HOT TOPICS LIST
- MACD
- Fibonacci
- RSI
- Gann
- ADXR
- Stochastics
- Volume
- Triangles
- Futures
- Cycles
- Volatility
- ZIGZAG
- MESA
- Retracement
- Aroon
INDICATORS LIST
LIST OF TOPICS
PRINT THIS ARTICLE
by Koos van der Merwe
McDonald's — Warren Buffett's favorite diet.
Position: N/A
Koos van der Merwe
Has been a technical analyst since 1969, and has worked as a futures and options trader with First Financial Futures in Johannesburg, South Africa.
PRINT THIS ARTICLE
OSCILLATORS
Investing In A Recession
01/02/08 08:13:36 AMby Koos van der Merwe
McDonald's — Warren Buffett's favorite diet.
Position: N/A
| Everyone knows McDonald's — the "Big Mac," as it is more commonly known — and everyone knows that the company was the forerunner of the fast food craze. Investors also know that the company is one of Warren Buffett's successful investments, and of course he supports his investment well by enjoying their hamburgers. "I only invest in what I understand," he argues, and I must admit, besides their hamburgers, McDonald's fries have no equal. So why am I looking at McDonald's now? Simple. If the United States is entering a recession as I believe it is, then we should invest in food chains. People have to eat, no matter how much poorer they become, and what is a better or cheaper meal than McDonald's? |

|
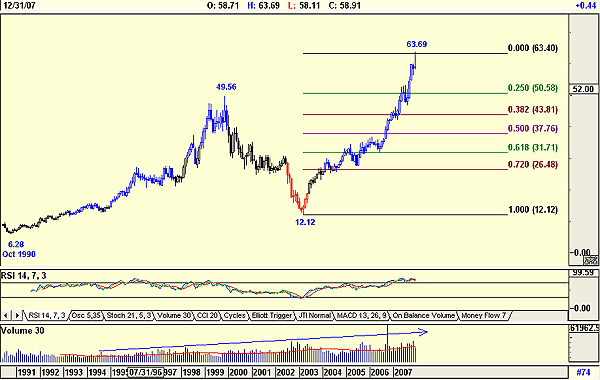
| FIGURE 1: MCD, MONTHLY. This chart of McDonald's suggests possible weakness. |
| Graphic provided by: AdvancedGET. |
| |
| Figure 1 is a monthly chart of the stock and shows how it rose from $6.28 in 1990 to the present high of $63.69. Of course there were hiccups on the way up, with the period from November 1999 until March 2003 being the worst, a drop from $49.56 to $12.12 being the worst. Surely this drop contradicts my earlier statement that in a recession, we should invest in companies that offer food to a hungry population. Well, I can only argue that the market collapse as the bubble burst in 2000 was not the forerunner of a recession, but the correction of a market that had run ahead of itself. The recovery of McDonald's to its current price presents that argument admirably. Figure 1 does suggest that a correction is due, with the relative strength index (RSI) at overbought levels, but a sell signal has not been given — yet. I write "yet," because I am expecting one. For this reason, assuming that the present price is the high, I have introduced Fibonacci levels, showing possible support and buy levels. Note the volume increase as the price rose. |

|
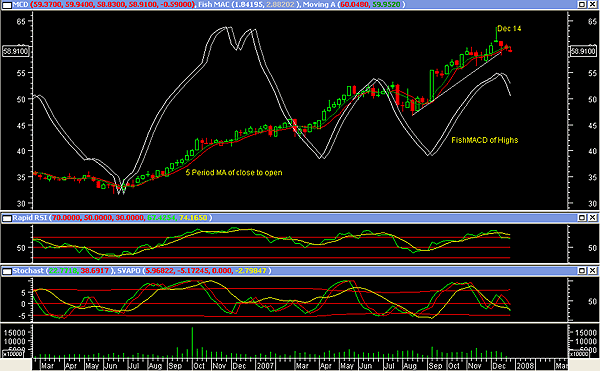
| FIGURE 2: MCD, WEEKLY. This chart shows sell signals given. |
| Graphic provided by: MetaStock. |
| |
| Figure 2 is a weekly chart, with the following indicators: a. Fisher transform of the moving average convergence/divergence (MACD) of the highs. This indicator gave a sell signal on the week ended December 14. b. A five-period moving average of the close (green) and the open (red). This indicator has only just given a sell signal. The indicator is better used on a daily chart. c. The rapid RSI, which has given a sell signal. d. The stochastic RSI (green and red in the lower window), which shows a negative trend, having given a sell signal on the week ended November 9. e. The SVAPO indicator in yellow, which gave a sell signal on the week ended November 16, and is still negative. |

|
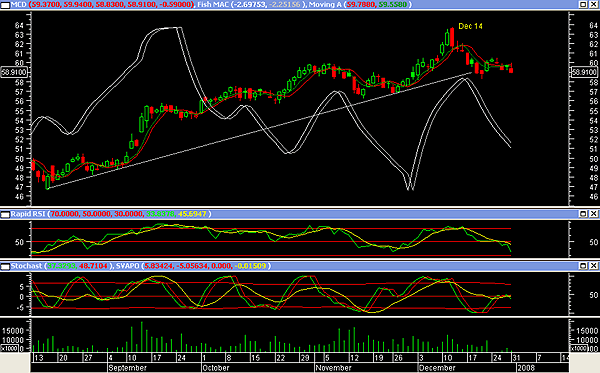
| FIGURE 3: MCD, DAILY. This chart shows short-term weakness. |
| Graphic provided by: MetaStock. |
| |
| Figure 3 is a daily chart, which would be used once the weekly and monthly charts have told me that it is time to buy the share. Obviously, here I am looking for a long-term investment to protect capital should a recession be forthcoming. However, present analysis using the same indicators I have used in the weekly chart are all pointing down, although the stochastic RSI did give a short-term buy on December 20, a buy signal not confirmed by any of the other indicators. |
| Note the extremely low volume, but this could be because of the holiday season. Would I buy McDonald's at this moment? The answer is no, but it is a stock on my watchlist should the US enter a recession, if it is not already in one. |
Has been a technical analyst since 1969, and has worked as a futures and options trader with First Financial Futures in Johannesburg, South Africa.
| Address: | 3256 West 24th Ave |
| Vancouver, BC | |
| Phone # for sales: | 6042634214 |
| E-mail address: | petroosp@gmail.com |
Click here for more information about our publications!
Comments
Date: 01/03/08Rank: 1Comment:

Request Information From Our Sponsors
- StockCharts.com, Inc.
- Candle Patterns
- Candlestick Charting Explained
- Intermarket Technical Analysis
- John Murphy on Chart Analysis
- John Murphy's Chart Pattern Recognition
- John Murphy's Market Message
- MurphyExplainsMarketAnalysis-Intermarket Analysis
- MurphyExplainsMarketAnalysis-Visual Analysis
- StockCharts.com
- Technical Analysis of the Financial Markets
- The Visual Investor
- VectorVest, Inc.
- Executive Premier Workshop
- One-Day Options Course
- OptionsPro
- Retirement Income Workshop
- Sure-Fire Trading Systems (VectorVest, Inc.)
- Trading as a Business Workshop
- VectorVest 7 EOD
- VectorVest 7 RealTime/IntraDay
- VectorVest AutoTester
- VectorVest Educational Services
- VectorVest OnLine
- VectorVest Options Analyzer
- VectorVest ProGraphics v6.0
- VectorVest ProTrader 7
- VectorVest RealTime Derby Tool
- VectorVest Simulator
- VectorVest Variator
- VectorVest Watchdog
