HOT TOPICS LIST
- MACD
- Fibonacci
- RSI
- Gann
- ADXR
- Stochastics
- Volume
- Triangles
- Futures
- Cycles
- Volatility
- ZIGZAG
- MESA
- Retracement
- Aroon
INDICATORS LIST
LIST OF TOPICS
PRINT THIS ARTICLE
by Gary Grosschadl
One of the hottest oil stocks around, this one ran from $5 in 2003 to $70 in only three years. Now it's attempting to go higher.
Position: Buy
Gary Grosschadl
Independent Canadian equities trader and technical analyst based in Peterborough
Ontario, Canada.
PRINT THIS ARTICLE
DESCENDING TRIANGLES
New High Territory For Ultra Petroleum Corp.
01/02/08 07:15:06 AMby Gary Grosschadl
One of the hottest oil stocks around, this one ran from $5 in 2003 to $70 in only three years. Now it's attempting to go higher.
Position: Buy
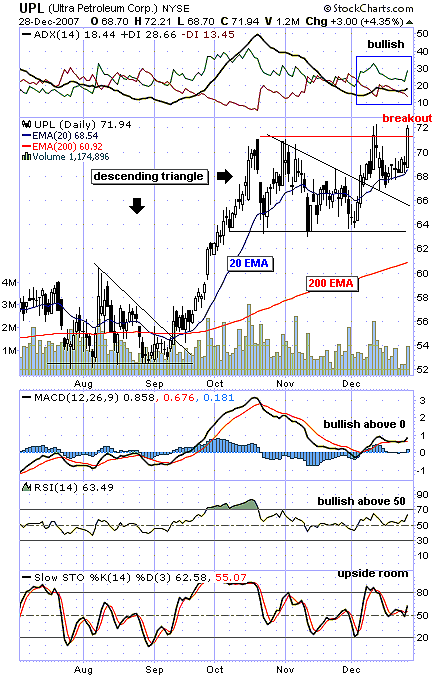
| Ultra Petroleum is an independent exploration and production company focused on its core properties in the Green River Basin of southwestern Wyoming. Figure 1 shows a potential breakout move. Volume is not yet convincing, though, and breakouts occur, preferably, on exceptional volume. |
| On this chart, the prevailing pattern is an advance fueled by descending triangle breakouts. Triangle breakouts often show up in continuation patterns where the prevailing trend is bullish. The ascending triangle breakout at the bottom of the chart from last September was on volume of more than two million shares. This resulted in a bullish run from $56 to $70. Note the good support from its 20-day exponential moving average (EMA). |

|
| FIGURE 1: UPL, DAILY. This chart shows oil stock breaking into new high territory. |
| Graphic provided by: StockCharts.com. |
| |
| That admirable run was consolidated by another larger descending triangle. Early in December 2007 the stock broke past this triangle with a bold thrust above its 20-day EMA; note the good support offered by that moving average since then. A strongly advancing stock often shows great support from the 20-day EMA. Now, the stock has made its highest close ever at the current $71.94. |
| We look for signs from several indicators to determine the odds of this move continuing higher. As already mentioned, volume is a little lacking, so this is cautionary. The directional movement indicator at the top of the chart is bullish, poised with an upsloping ADX (average directional movement index) line bullishly poised between the positive and negative DIs (directional indicators). This hints at improving trend strength. Ideally, the ADX should be above the 20 level so at 18.44, it is a little wanting. The indicators below the chart are also showing bullish promise. The moving average convergence/divergence (MACD) is showing strength above its zero-line while the relative strength index (RSI) is above its key 50 level. The stochastic oscillator is above its midrange, so upside room is showing. |
| Whether this move transpires into another 16-point rise from the triangle's breakout point remains to be seen. We mustn't get too greedy. Should a nice advance ensue, watch for a convincing candlestick warning of the rise being over; note the large bearish engulfing candlestick pattern from last October. That was an excellent signal that the rise was finished before going into a lengthly consolidation pattern. |
Independent Canadian equities trader and technical analyst based in Peterborough
Ontario, Canada.
| Website: | www.whatsonsale.ca/financial.html |
| E-mail address: | gwg7@sympatico.ca |
Click here for more information about our publications!
Comments
Date: 01/03/08Rank: 3Comment:

Request Information From Our Sponsors
- StockCharts.com, Inc.
- Candle Patterns
- Candlestick Charting Explained
- Intermarket Technical Analysis
- John Murphy on Chart Analysis
- John Murphy's Chart Pattern Recognition
- John Murphy's Market Message
- MurphyExplainsMarketAnalysis-Intermarket Analysis
- MurphyExplainsMarketAnalysis-Visual Analysis
- StockCharts.com
- Technical Analysis of the Financial Markets
- The Visual Investor
- VectorVest, Inc.
- Executive Premier Workshop
- One-Day Options Course
- OptionsPro
- Retirement Income Workshop
- Sure-Fire Trading Systems (VectorVest, Inc.)
- Trading as a Business Workshop
- VectorVest 7 EOD
- VectorVest 7 RealTime/IntraDay
- VectorVest AutoTester
- VectorVest Educational Services
- VectorVest OnLine
- VectorVest Options Analyzer
- VectorVest ProGraphics v6.0
- VectorVest ProTrader 7
- VectorVest RealTime Derby Tool
- VectorVest Simulator
- VectorVest Variator
- VectorVest Watchdog
