

HOT TOPICS LIST
- MACD
- Fibonacci
- RSI
- Gann
- ADXR
- Stochastics
- Volume
- Triangles
- Futures
- Cycles
- Volatility
- ZIGZAG
- MESA
- Retracement
- Aroon
INDICATORS LIST
LIST OF TOPICS
PRINT THIS ARTICLE
by David Penn
The developing head and shoulders top in Goldman Sachs might not complete itself until the spring of 2001. But a downside breakout could send share prices plummeting to levels not seen since 1999.
Position: N/A
David Penn
Technical Writer for Technical Analysis of STOCKS & COMMODITIES magazine, Working-Money.com, and Traders.com Advantage.
PRINT THIS ARTICLE
HEAD & SHOULDERS
Goldman Sachs' HUGE Head and Shoulders Top
02/20/01 09:26:33 AMby David Penn
The developing head and shoulders top in Goldman Sachs might not complete itself until the spring of 2001. But a downside breakout could send share prices plummeting to levels not seen since 1999.
Position: N/A
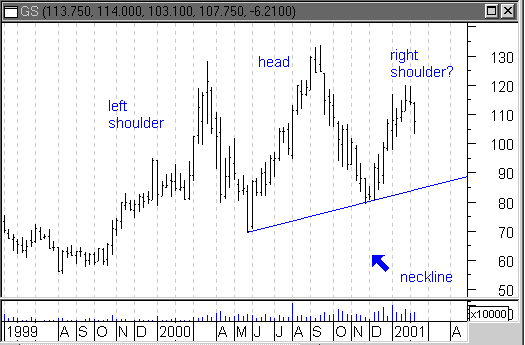
| Conventional wisdom suggests that chart patterns that are often difficult to discern on a daily basis sometimes become all the more clear when periodicity is expanded to, say, a weekly basis. Taking that cue in re-examining Goldman Sachs (NYSE: GS), I opened up a weekly chart of the finance giant. While there are many who suggest that shares in companies like Goldman Sachs are those most likely to appreciate during the current declining interest rate environment, the weekly chart of GS suggests the same thing that the daily chart does: a head and shoulders top. A bearish reversal. |
| You be the judge. The head and shoulders top is one of the more recognizable chart patterns in technical analysis. As it sounds, the head and shoulders top consists of a trio of peaks in share price during a period in which prices are, relatively speaking, in high territory. The middle peak of the two is higher than the others, hence the head and shoulders name. Generally speaking, a head and shoulders top formations suggests a succession of buying waves by increasingly weak buyers. The increasing weakness of buyers becomes evident as the third peak fails to make a high vis-a-vis the central, highest, peak and selling begins to take hold. |
|
| Falling prices for shares of Goldman Sachs may be anticipating significant further declines if the developing head and shoulders top formation is any indication. |
| Graphic provided by: MetaStock. |
| |
| This selling develops a momentum of its own as those who bought shares at either of the previous peak highs begin dumping shares, as well. This bearish momentum is what brings prices down to what is called the neckline (a trend line connecting the lows of the two troughs between the three peaks), ultimately breaking out on the downside. |
| There are a few things in the developing Goldman Sachs head and shoulders top that are not as they could (read: prefer) be. Generally, volume is higher on the left shoulder than on the right, as is the case here. And it remains to be seen whether or not shares of Goldman Sachs will continue their declines through February. For this particular head and shoulders top formation to work (meaning a downside breakout), prices for GS will have to decline another $20 (from 103 to the low to mid 80s) just to reach the neckline. If the left shoulder is any indication, then it could take the right shoulder another month or two before making these declines--assuming these declines take place, at all. |
| A successful head and shoulders top in Goldman Sachs would be a significant event, indeed. The likely downside price objective--reached by subtracting the neckline value from the highest high in the formation and subtracting that amount from the value at which prices breakout downward--is an amazing $27, a 75% discount from the stock's current price. This assumes prices cross the neckline around the mid to low 80s. Be on the lookout for pullbacks after any neckline cross. Even if GS is fated to endure a 75% drop in the intermediate term, it is certainly not going to happen in one savage move. |
Technical Writer for Technical Analysis of STOCKS & COMMODITIES magazine, Working-Money.com, and Traders.com Advantage.
| Title: | Technical Writer |
| Company: | Technical Analysis, Inc. |
| Address: | 4757 California Avenue SW |
| Seattle, WA 98116 | |
| Phone # for sales: | 206 938 0570 |
| Fax: | 206 938 1307 |
| Website: | www.Traders.com |
| E-mail address: | DPenn@traders.com |
Traders' Resource Links | |
| Charting the Stock Market: The Wyckoff Method -- Books | |
| Working-Money.com -- Online Trading Services | |
| Traders.com Advantage -- Online Trading Services | |
| Technical Analysis of Stocks & Commodities -- Publications and Newsletters | |
| Working Money, at Working-Money.com -- Publications and Newsletters | |
| Traders.com Advantage -- Publications and Newsletters | |
| Professional Traders Starter Kit -- Software | |
Click here for more information about our publications!
Comments

Request Information From Our Sponsors
- StockCharts.com, Inc.
- Candle Patterns
- Candlestick Charting Explained
- Intermarket Technical Analysis
- John Murphy on Chart Analysis
- John Murphy's Chart Pattern Recognition
- John Murphy's Market Message
- MurphyExplainsMarketAnalysis-Intermarket Analysis
- MurphyExplainsMarketAnalysis-Visual Analysis
- StockCharts.com
- Technical Analysis of the Financial Markets
- The Visual Investor
- VectorVest, Inc.
- Executive Premier Workshop
- One-Day Options Course
- OptionsPro
- Retirement Income Workshop
- Sure-Fire Trading Systems (VectorVest, Inc.)
- Trading as a Business Workshop
- VectorVest 7 EOD
- VectorVest 7 RealTime/IntraDay
- VectorVest AutoTester
- VectorVest Educational Services
- VectorVest OnLine
- VectorVest Options Analyzer
- VectorVest ProGraphics v6.0
- VectorVest ProTrader 7
- VectorVest RealTime Derby Tool
- VectorVest Simulator
- VectorVest Variator
- VectorVest Watchdog