HOT TOPICS LIST
- MACD
- Fibonacci
- RSI
- Gann
- ADXR
- Stochastics
- Volume
- Triangles
- Futures
- Cycles
- Volatility
- ZIGZAG
- MESA
- Retracement
- Aroon
INDICATORS LIST
LIST OF TOPICS
PRINT THIS ARTICLE
by Gary Grosschadl
The biggest dog this year — off 60% — on the NASDAQ 100 was Sepracor Inc. Purely from a technical view, it looks interesting.
Position: Accumulate
Gary Grosschadl
Independent Canadian equities trader and technical analyst based in Peterborough
Ontario, Canada.
PRINT THIS ARTICLE
CHART ANALYSIS
Bottom-Picking The Worst Stock
12/31/07 09:10:42 AMby Gary Grosschadl
The biggest dog this year — off 60% — on the NASDAQ 100 was Sepracor Inc. Purely from a technical view, it looks interesting.
Position: Accumulate
| Woe is the stock that underperforms or misses guidance. Off by a whopping 60%, this drug maker was severely punished for its abysmal quarterly report last summer, hampered by poor drug sales. Bottom-picking is a dangerous game, as those who rush in too soon can catch a falling knife. The air looks like it's finally out of this balloon, so a closer look is tempting. |
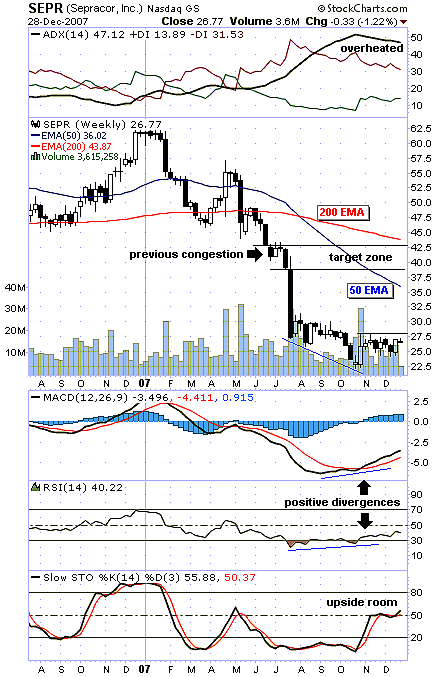
| Several factors are worth considering. The stock has been in a basing period the past eight weeks between $25 and $27.50. When a stock does this, I like to see signs of positive divergence. This can be seen via the moving average convergence/divergence (MACD) and the relative strength index (RSI). Both show an upswing while the stock was making a new low near $22.50. Positive divergences often point to a coming up leg or bounce. |

|
| FIGURE 1: SEPR, WEEKLY. This chart ponders the likelihood of a bounce. |
| Graphic provided by: StockCharts.com. |
| |
| Above the chart (Figure 1), the directional movement indicator (DMI) is considered. When the average directional movement index (ADX) line rides above the DIs (directional indicators) and is generally at a high level, an overheated condition is deemed. This hints at a coming trend reversal where the DIs start to converge. A reversal occurs when the positive (green) DI crosses above the negative (red) DI. Then the bulls are back in charge. By this time the stock will be off the bottom, as this tends to be a bit of a lagging indicator. The stochastics oscillator shows some midrange support with upside room, not a bad sign. |
| Should the stock bounce from here, a target zone between $39 and $43 is considered. This represents a previous congestion zone from last summer. Previous congestion zones often mark important resistance areas. Two nearby moving average lines may also come into play. An advance toward the target zone could be halted by overhead resistance of the 50-period exponential moving average (EMA) (currently $36). The 200-period EMA often offers formidable resistance in any time frame. This level relates to the upper edge of the target zone. Traders often target spikes to this very visible moving average line. |
| Technically, this stock looks worthy of consideration for intrepid traders with a high risk tolerance. Of course, due diligence also comes into play as it always should, especially when considering beaten-up stocks, as some simply roll over and die. |
Independent Canadian equities trader and technical analyst based in Peterborough
Ontario, Canada.
| Website: | www.whatsonsale.ca/financial.html |
| E-mail address: | gwg7@sympatico.ca |
Click here for more information about our publications!
Comments
Date: 01/02/08Rank: 5Comment:

Request Information From Our Sponsors
- StockCharts.com, Inc.
- Candle Patterns
- Candlestick Charting Explained
- Intermarket Technical Analysis
- John Murphy on Chart Analysis
- John Murphy's Chart Pattern Recognition
- John Murphy's Market Message
- MurphyExplainsMarketAnalysis-Intermarket Analysis
- MurphyExplainsMarketAnalysis-Visual Analysis
- StockCharts.com
- Technical Analysis of the Financial Markets
- The Visual Investor
- VectorVest, Inc.
- Executive Premier Workshop
- One-Day Options Course
- OptionsPro
- Retirement Income Workshop
- Sure-Fire Trading Systems (VectorVest, Inc.)
- Trading as a Business Workshop
- VectorVest 7 EOD
- VectorVest 7 RealTime/IntraDay
- VectorVest AutoTester
- VectorVest Educational Services
- VectorVest OnLine
- VectorVest Options Analyzer
- VectorVest ProGraphics v6.0
- VectorVest ProTrader 7
- VectorVest RealTime Derby Tool
- VectorVest Simulator
- VectorVest Variator
- VectorVest Watchdog
