HOT TOPICS LIST
- MACD
- Fibonacci
- RSI
- Gann
- ADXR
- Stochastics
- Volume
- Triangles
- Futures
- Cycles
- Volatility
- ZIGZAG
- MESA
- Retracement
- Aroon
INDICATORS LIST
LIST OF TOPICS
PRINT THIS ARTICLE
by Mike Carr, CMT
China delivered incredible returns in 2007, but what about next year?
Position: Buy
Mike Carr, CMT
Mike Carr, CMT, is a member of the Market Technicians Association, and editor of the MTA's newsletter, Technically Speaking. He is also the author of "Smarter Investing in Any Economy: The Definitive Guide to Relative Strength Investing," and "Conquering the Divide: How to Use Economic Indicators to Catch Stock Market Trends."
PRINT THIS ARTICLE
POINT & FIGURE
The Hot Market in 2007 -- China
12/31/07 08:59:58 AMby Mike Carr, CMT
China delivered incredible returns in 2007, but what about next year?
Position: Buy
| One February morning, US investors woke up to the news that a plunge in Chinese stocks had triggered a European market selloff, and US futures were down sharply. By the end of the day, the Dow Jones Industrial Average (DJIA) had fallen more than 400 points. But the world's markets quickly recovered and China's market led the way. For the year, the Shanghai Composite index is up by 97%, making it the world's best-performing stock market index. |
| Looking at the year ahead is difficult. But at least one exchange traded fund (ETF) shows signs of continued strength. The China Fund (CHN) looks like a buy, even after the long run up. A word of caution is needed here: on December 19, 2007, the stock went ex-dividend, usually a minor blip on the charts. In this case, the distribution totaled $12.12, and many data vendors did not adjust for this. Most web-based charts show a large downside gap for that day, and all chart formations and indicators are therefore worthless. Especially at this time of year as distributions are paid, know your data vendor and verify gaps. |
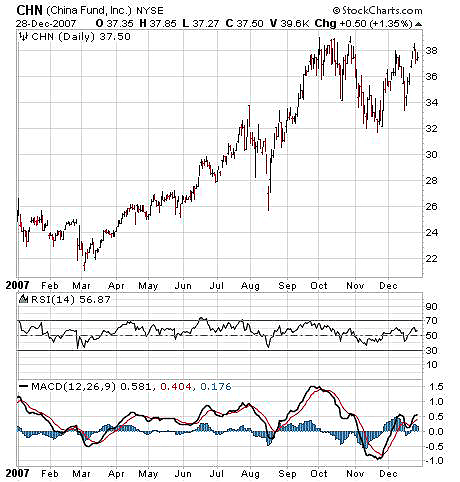
| StockCharts.com adjusted prices to account for the large distribution, and the daily chart (Figure 1) is still bullish. The stock is well above its trendline and the most recent action shows a higher low followed by a higher high, the definition of an uptrend. The relative strength index (RSI) is far from overbought, but the moving average convergence/divergence (MACD) may be showing signs of a top. |

|
| FIGURE 1: CHINA FUND, DAILY. The bar chart of China Fund (CHN) shows a steady uptrend, not the parabolic curve you'd expect to see in a stock that doubled in the past year. |
| Graphic provided by: StockCharts.com. |
| |
| The point & figure chart of CHN (Figure 2) is extended, but also supportive of higher prices. The most recent column of Xs verifies the short-term uptrend. The consolidation is healthy after such an extended run and provides a measured price objective of 66 if prices clear 39. |

|
| FIGURE 2: CHINA FUND, POINT & FIGURE. The point & figure chart shows a healthy consolidation under way, and counting across the recent formation yields a measured move of 27 points after a breakout occurs. |
| Graphic provided by: StockCharts.com. |
| |
| For those seeking a conservative trade on a high-flier, CHN offers a great deal of potential. Entry can await confirmation that prices are breaking out to the upside, and a buy-stop order can be placed at 39, just above recent highs. Violating support at 32 would indicate the long uptrend has been broken. Few trades in such volatile stocks offer a 4:1 reward-to-risk ratio. |
Mike Carr, CMT, is a member of the Market Technicians Association, and editor of the MTA's newsletter, Technically Speaking. He is also the author of "Smarter Investing in Any Economy: The Definitive Guide to Relative Strength Investing," and "Conquering the Divide: How to Use Economic Indicators to Catch Stock Market Trends."
| Website: | www.moneynews.com/blogs/MichaelCarr/id-73 |
| E-mail address: | marketstrategist@gmail.com |
Click here for more information about our publications!
Comments
Date: 01/02/08Rank: 1Comment:
Date: 04/29/08Rank: 5Comment:

Request Information From Our Sponsors
- StockCharts.com, Inc.
- Candle Patterns
- Candlestick Charting Explained
- Intermarket Technical Analysis
- John Murphy on Chart Analysis
- John Murphy's Chart Pattern Recognition
- John Murphy's Market Message
- MurphyExplainsMarketAnalysis-Intermarket Analysis
- MurphyExplainsMarketAnalysis-Visual Analysis
- StockCharts.com
- Technical Analysis of the Financial Markets
- The Visual Investor
- VectorVest, Inc.
- Executive Premier Workshop
- One-Day Options Course
- OptionsPro
- Retirement Income Workshop
- Sure-Fire Trading Systems (VectorVest, Inc.)
- Trading as a Business Workshop
- VectorVest 7 EOD
- VectorVest 7 RealTime/IntraDay
- VectorVest AutoTester
- VectorVest Educational Services
- VectorVest OnLine
- VectorVest Options Analyzer
- VectorVest ProGraphics v6.0
- VectorVest ProTrader 7
- VectorVest RealTime Derby Tool
- VectorVest Simulator
- VectorVest Variator
- VectorVest Watchdog
