HOT TOPICS LIST
- MACD
- Fibonacci
- RSI
- Gann
- ADXR
- Stochastics
- Volume
- Triangles
- Futures
- Cycles
- Volatility
- ZIGZAG
- MESA
- Retracement
- Aroon
INDICATORS LIST
LIST OF TOPICS
PRINT THIS ARTICLE
by Gary Grosschadl
This Canadian stock is bouncing off a bottom hammer. How far will it go?
Position: Buy
Gary Grosschadl
Independent Canadian equities trader and technical analyst based in Peterborough
Ontario, Canada.
PRINT THIS ARTICLE
CHART ANALYSIS
Telus Corp. Marks Bottom
12/28/07 10:55:14 AMby Gary Grosschadl
This Canadian stock is bouncing off a bottom hammer. How far will it go?
Position: Buy
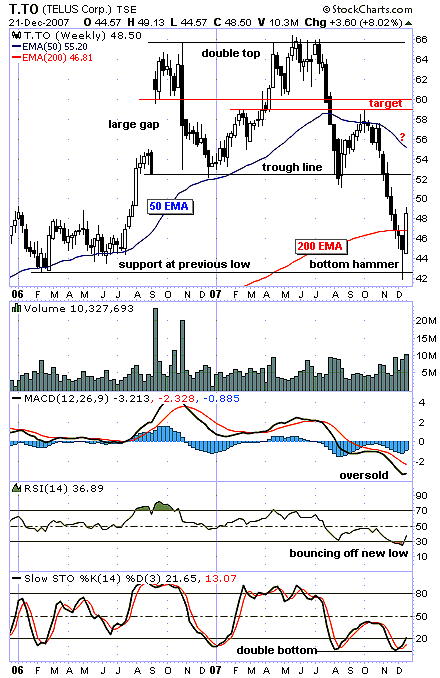
| Telus Corp. trades on the Toronto Stock Exchange (T) and this weekly chart suggests a tradable bounce is occurring (Figure 1). After a significant downturn from a high of $66, the bottom hammer dipped to $42 recently on this two-year weekly chart. The bottom hammer was confirmed higher the following week with the close of $48.50. |
| The pattern illustrated was a double top, which found temporary support at the trendline late last summer as the stock brushed $52. The subsequent rally proved to be a bear rally failing at the overhead 50-day exponential moving average (EMA) line. This led to the eventual double-top breakdown as the trendline was violated to the downside. The downside move fell short of the ideal measurement for this pattern being a move below the trendline equal to the peak above that same line. This potentially was a move 14 points below the trendline or down to $36 rather than the touch to $42. |

|
| FIGURE 1: TELUS, WEEKLY. This chart suggests a tradable bounce. |
| Graphic provided by: StockCharts.com. |
| |
| The target here is $59–60, which represents previous levels of support and resistance, including the top of the large gap. The potential fly in the ointment is overhead resistance, offered by the 50-day exponential moving average (EMA), currently $52.50. This could represent another bear rally to that moving average line. |
| Several indicators are considered on this chart. The moving average convergence/divergence (MACD) shows a very oversold condition reflecting the bounce potential, while the relative strength index (RSI) hints at a bounce off a new low near the 30 level. The stochastic oscillator also shows a move off oversold levels with a double-bottom formation. |
| In summary, a bounce is in the making — how far will it go? A move near $60 would be a profitable one for aggressive short-term or midterm traders. One caveat is a bear rally that could die at overhead resistance at the 50-day EMA. Only time will tell. |
Independent Canadian equities trader and technical analyst based in Peterborough
Ontario, Canada.
| Website: | www.whatsonsale.ca/financial.html |
| E-mail address: | gwg7@sympatico.ca |
Click here for more information about our publications!
PRINT THIS ARTICLE

Request Information From Our Sponsors
- StockCharts.com, Inc.
- Candle Patterns
- Candlestick Charting Explained
- Intermarket Technical Analysis
- John Murphy on Chart Analysis
- John Murphy's Chart Pattern Recognition
- John Murphy's Market Message
- MurphyExplainsMarketAnalysis-Intermarket Analysis
- MurphyExplainsMarketAnalysis-Visual Analysis
- StockCharts.com
- Technical Analysis of the Financial Markets
- The Visual Investor
- VectorVest, Inc.
- Executive Premier Workshop
- One-Day Options Course
- OptionsPro
- Retirement Income Workshop
- Sure-Fire Trading Systems (VectorVest, Inc.)
- Trading as a Business Workshop
- VectorVest 7 EOD
- VectorVest 7 RealTime/IntraDay
- VectorVest AutoTester
- VectorVest Educational Services
- VectorVest OnLine
- VectorVest Options Analyzer
- VectorVest ProGraphics v6.0
- VectorVest ProTrader 7
- VectorVest RealTime Derby Tool
- VectorVest Simulator
- VectorVest Variator
- VectorVest Watchdog
