HOT TOPICS LIST
- MACD
- Fibonacci
- RSI
- Gann
- ADXR
- Stochastics
- Volume
- Triangles
- Futures
- Cycles
- Volatility
- ZIGZAG
- MESA
- Retracement
- Aroon
INDICATORS LIST
LIST OF TOPICS
PRINT THIS ARTICLE
by Chaitali Mohile
The flag & pennant breakout in the stock rallied to new highs on overbought RSI; the doji star may drag down the stock moderately.
Position: Hold
Chaitali Mohile
Active trader in the Indian stock markets since 2003 and a full-time writer. Trading is largely based upon technical analysis.
PRINT THIS ARTICLE
FLAGS AND PENNANTS
SOLF Has Bullish Breakout
12/31/07 12:24:33 PMby Chaitali Mohile
The flag & pennant breakout in the stock rallied to new highs on overbought RSI; the doji star may drag down the stock moderately.
Position: Hold
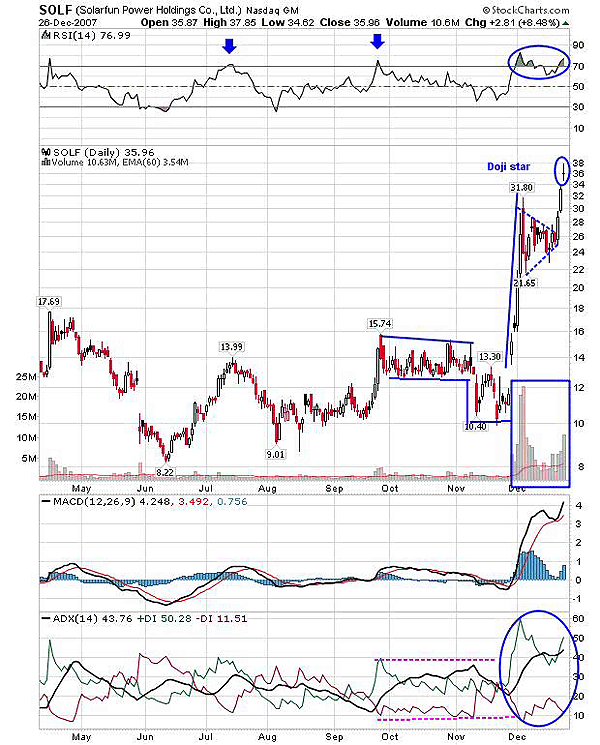
| After the gap up from the volatile consolidation in early December, Solarfun Power Holdings Co Ltd. rallied extensively to new levels at 31.80. The third-quarter report showed the earnings per share (EPS) at 17 cents and revenues of $100.6 million, whereas analysts' expectations were EPS of 5 cents and revenues of $76.0 million. With the news, the stock entered a bullish consolidation forming a pennant following the advance rally. The flag & pennant is a bullish continuation pattern, with prices breakint out in an upside direction. The stock has been in an uptrend since early October, according to the average directional movement index (ADX) (14) in Figure 1. Earlier, the stock had large volatile sessions, retracing to its previous low during the bullish consolidation in the 13-15 range. |
| The volume rose with the gap breakout from consolidation, and the price moved to the 31.80 level. In addition, as the pennant was formed the volume dropped again, affecting the positive directional index +DI of ADX; that declined to 40 levels from 60. Meanwhile, the relative strength index (RSI) (14) marginally moved below 70, sustaining its overbought levels. The bullish breakout finally occurred on Friday, December 21, with the price surging to new heights with increasing volume that helped sustain the breakout. The stock gained ~ $12 in three days, giving traders handsome profits on Christmas Eve. The minimum estimated levels on the breakout is at $43.80. Here we measure the size of the flagpole of the advance rally (31.80 - 14 = 17.8) and add $17.80 to the breakout level at $26. |
| But the twist in the tale is the overbought level in the RSI (14), which never before has crossed 80 (see Figure 1 and the market arrows in RSI), and the doji star that is formed after the bullish session on Monday. The stock is very strong with a long-term perspective, but the resistance in RSI (14) brings in the clouds of fear and indecision on the price chart. If SOLF undergoes the bearish session, the evening doji may pull down the stock temporarily. Long positions should be carried with a tight stop-loss of 30. But the bearish reversal candlestick pattern is yet to form and the ADX (14) indicates the stock is very well in a strong uptrend so there is no harm in holding the stock till the target gets hit. |

|
| FIGURE 1: SOLF, DAILY. The flag & pennant breakout has two hurdles in a bullish rally; the overbought RSI (14) that never moved above 80 and the doji star. The MACD (12,26,9) and the ADX (14) are bullish, and they indicate a strong uptrend to sustain in the future as well. |
| Graphic provided by: StockCharts.com. |
| |
| The moving average convergence/divergence (MACD) (12,26,9) is equally positive and supports a future bullish rally. So the dip that may arise due to the overbought RSI (14) and the doji star (perhaps evening doji star if formed) can be a good buying level with the same estimated level. Those already long should observe the mentioned stop-loss (30) and carry the long positions. |
Active trader in the Indian stock markets since 2003 and a full-time writer. Trading is largely based upon technical analysis.
| Company: | Independent |
| Address: | C1/3 Parth Indraprasth Towers. Vastrapur |
| Ahmedabad, Guj 380015 | |
| E-mail address: | chaitalimohile@yahoo.co.in |
Traders' Resource Links | |
| Independent has not added any product or service information to TRADERS' RESOURCE. | |
Click here for more information about our publications!
Comments
Date: 01/02/08Rank: 4Comment:

Request Information From Our Sponsors
- StockCharts.com, Inc.
- Candle Patterns
- Candlestick Charting Explained
- Intermarket Technical Analysis
- John Murphy on Chart Analysis
- John Murphy's Chart Pattern Recognition
- John Murphy's Market Message
- MurphyExplainsMarketAnalysis-Intermarket Analysis
- MurphyExplainsMarketAnalysis-Visual Analysis
- StockCharts.com
- Technical Analysis of the Financial Markets
- The Visual Investor
- VectorVest, Inc.
- Executive Premier Workshop
- One-Day Options Course
- OptionsPro
- Retirement Income Workshop
- Sure-Fire Trading Systems (VectorVest, Inc.)
- Trading as a Business Workshop
- VectorVest 7 EOD
- VectorVest 7 RealTime/IntraDay
- VectorVest AutoTester
- VectorVest Educational Services
- VectorVest OnLine
- VectorVest Options Analyzer
- VectorVest ProGraphics v6.0
- VectorVest ProTrader 7
- VectorVest RealTime Derby Tool
- VectorVest Simulator
- VectorVest Variator
- VectorVest Watchdog
