HOT TOPICS LIST
- MACD
- Fibonacci
- RSI
- Gann
- ADXR
- Stochastics
- Volume
- Triangles
- Futures
- Cycles
- Volatility
- ZIGZAG
- MESA
- Retracement
- Aroon
INDICATORS LIST
LIST OF TOPICS
PRINT THIS ARTICLE
by Mike Carr, CMT
Thanksgiving and Christmas seasonal trades are well known. But this same idea can be applied to sectors, and we find a surprising seasonal strategy for January.
Position: Buy
Mike Carr, CMT
Mike Carr, CMT, is a member of the Market Technicians Association, and editor of the MTA's newsletter, Technically Speaking. He is also the author of "Smarter Investing in Any Economy: The Definitive Guide to Relative Strength Investing," and "Conquering the Divide: How to Use Economic Indicators to Catch Stock Market Trends."
PRINT THIS ARTICLE
SEASONAL TRADING
Buy Retailers For A Seasonal Bounce
12/28/07 09:53:41 AMby Mike Carr, CMT
Thanksgiving and Christmas seasonal trades are well known. But this same idea can be applied to sectors, and we find a surprising seasonal strategy for January.
Position: Buy
| The recent holidays always generate interest in seasonal trading strategies in the stock market. Unfortunately, many unsuccessful investors forget about this idea after Christmas and go back to buy-and-hope strategies, while successful traders continue to rely on their technical strategies for profits. Seasonal strategies offer untapped ways for both of these groups to benefit with a little research and discipline. Seasonal trades involve identifying the best days to buy and sell during a certain time frame. In this case, we want to look beyond simple market timing and see if we can outperform the market using an industry-based exchange traded fund (ETF). Testing this idea is relatively simple. We will test each industry to measure their average gains during January, looking to the most reliable gains to develop a trading strategy. |
| As a point of reference, the S&P 500 ETF (SPY) has shown an average gain of 1.2% in January over the past 19 years. There were 12 winners and seven losers. The biggest winner was 7.9% and the largest loss more than 8.5%. Using data provided by Genesis Financial Technology, there are 101 industry groups to test and 75% of the groups showed profits over the test period. |
| Whenever a strategy is backtested, careful analysis is required to ensure that future results have a chance of duplicating past performance. In this case, the Computer Storage Device industry group shows the best raw performance, with 78% of the trades being winners. But looking closer, we learn that the largest winner accounts for 75% of the total profits. Removing that trade significantly changes the risk–reward characteristics of this trading strategy. |

|
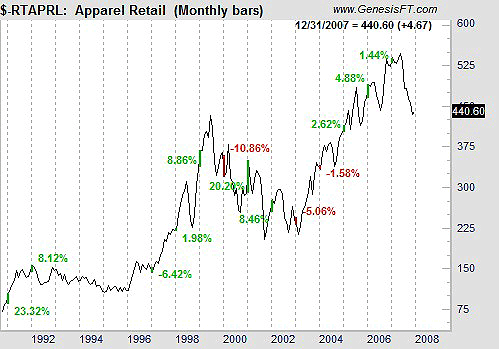
| FIGURE 1: RTAPRL, MONTHLY. Apparel retailers often do well in January as holiday sales are totaled up. This chart shows winning trades in 10 of the past 13 years. |
| Graphic provided by: Trade Navigator. |
| |
| When we adjust for risk, the best performer is Apparel Retailers. This trade was a winner in 13 of the last 18 years (72.2% winners), and the average trade retuned 4%, nearly four times the average gains of the S&P 500. The largest winner returned 24%, nearly 30% of the total profits, and the largest loser was almost 11%. Recent trade history is shown in Figure 1. |

|
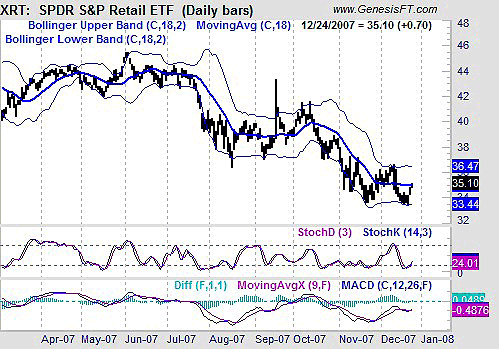
| FIGURE 2: XRT, DAILY. XRT may have reached a bottom as bad news dominates the headlines while technicals support higher prices. |
| Graphic provided by: Trade Navigator. |
| |
| Traders looking to take advantage of this seasonal strategy can buy the S&P Retail ETF (XRT). Figure 2 shows what may be a double-bottom formation, and stochastics and the MACD gave buy signals over the past few days. The lower Bollinger Band, at 33.44, offers support and an ideal location for a stop — overall, a low-risk trade in an industry beat down by the news of lackluster holiday sales. This news background may very well provide a wall of worry for the stock to climb. |
Mike Carr, CMT, is a member of the Market Technicians Association, and editor of the MTA's newsletter, Technically Speaking. He is also the author of "Smarter Investing in Any Economy: The Definitive Guide to Relative Strength Investing," and "Conquering the Divide: How to Use Economic Indicators to Catch Stock Market Trends."
| Website: | www.moneynews.com/blogs/MichaelCarr/id-73 |
| E-mail address: | marketstrategist@gmail.com |
Click here for more information about our publications!
Comments
Date: 01/02/08Rank: 5Comment:
Date: 01/02/08Rank: 1Comment:

Request Information From Our Sponsors
- StockCharts.com, Inc.
- Candle Patterns
- Candlestick Charting Explained
- Intermarket Technical Analysis
- John Murphy on Chart Analysis
- John Murphy's Chart Pattern Recognition
- John Murphy's Market Message
- MurphyExplainsMarketAnalysis-Intermarket Analysis
- MurphyExplainsMarketAnalysis-Visual Analysis
- StockCharts.com
- Technical Analysis of the Financial Markets
- The Visual Investor
- VectorVest, Inc.
- Executive Premier Workshop
- One-Day Options Course
- OptionsPro
- Retirement Income Workshop
- Sure-Fire Trading Systems (VectorVest, Inc.)
- Trading as a Business Workshop
- VectorVest 7 EOD
- VectorVest 7 RealTime/IntraDay
- VectorVest AutoTester
- VectorVest Educational Services
- VectorVest OnLine
- VectorVest Options Analyzer
- VectorVest ProGraphics v6.0
- VectorVest ProTrader 7
- VectorVest RealTime Derby Tool
- VectorVest Simulator
- VectorVest Variator
- VectorVest Watchdog
