HOT TOPICS LIST
- MACD
- Fibonacci
- RSI
- Gann
- ADXR
- Stochastics
- Volume
- Triangles
- Futures
- Cycles
- Volatility
- ZIGZAG
- MESA
- Retracement
- Aroon
INDICATORS LIST
LIST OF TOPICS
PRINT THIS ARTICLE
by Mike Carr, CMT
Using ETFs, stock traders can take advantage of currency trends.
Position: Buy
Mike Carr, CMT
Mike Carr, CMT, is a member of the Market Technicians Association, and editor of the MTA's newsletter, Technically Speaking. He is also the author of "Smarter Investing in Any Economy: The Definitive Guide to Relative Strength Investing," and "Conquering the Divide: How to Use Economic Indicators to Catch Stock Market Trends."
PRINT THIS ARTICLE
CHART ANALYSIS
Buying The Loonie As A Stock Trade
12/28/07 09:38:59 AMby Mike Carr, CMT
Using ETFs, stock traders can take advantage of currency trends.
Position: Buy
| The loonie is what Canadians affectionately call their one-dollar coin, which bears the image of a loon, a common Canadian bird. The currency has been in the news of late, as the Canadian dollar has reached all-time highs against the US dollar, with the loonie reaching parity against the US dollar for the first time. Years ago, only forex and futures traders could have taken advantage of this trading pair, which shows a nice history of trending behavior. Exchange traded funds (ETFs) now make currency trading accessible to those traders seeking the exposure and profit potential of foreign currencies without the high leverage associated with the trading vehicles. |
| CurrencyShares Canadian Dollar Trust (FXC) offers stock investors a way to bet on continued strength in the Canadian dollar. The ETF increases in value as the loonie strengthens, and decreases in value as the US dollar strengthens. The US currency has been in a steady decline for more than five years, and the popular media proclaims that there is no end to the freefall in sight. This ETF, along with others offered by CurrencyShares, make a new asset class available to conservative investors. |
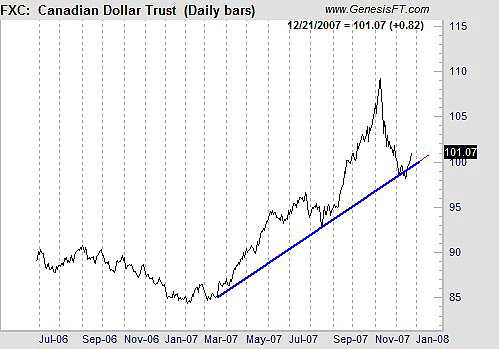
| The chart of FXC looks bullish. FXC recently bounced off a long-term trendline supporting what has been a steady, year-long up move (Figure 1). It now seems ready to make a run at recent highs after a normal pullback from overextended prices. Often when a stock gets that far above its trendline, a rapid decline sets in. in this case, the trendline held, which usually means the uptrend will resume. |

|
| FIGURE 1: FXC, DAILY. FXC went through its trendline after a nearly parabolic rise and decline. It rose right back through the trendline, offering a bullish buy signal. |
| Graphic provided by: Trade Navigator. |
| |
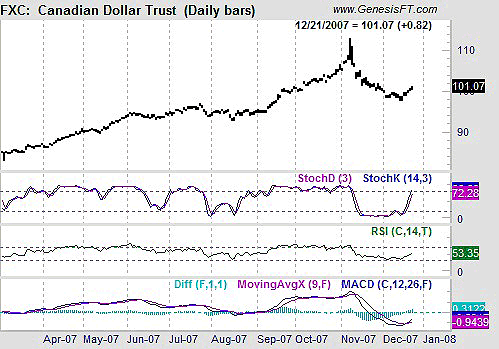
| Momentum indicators also signal further gains are likely in this stock. Stochastics, relative strength index (RSI), and the moving average convergence/divergence (MACD) all worked well at the spike top in early November, giving very timely sell signals from overbought levels. During the brief decline, the RSI held above 40, indicating that recent price action is a normal correction in a bull market. All indicators are now showing strong buy signals. (See Figures 1 and 2.) |

|
| FIGURE 2: FXC, DAILY. Although stochastics is near overbought levels, it has a tendency to stay at those levels in FXC. RSI recently tuned higher and the MACD just gave a bullish signal. Strong indications of another leg up. |
| Graphic provided by: Trade Navigator. |
| |
| A break of the recent lows, near 98, would indicate that the US dollar has reached an intermediate-term bottom and would tell us that this trade will not work. That's a risk of about 3%, an extraordinarily small amount in what should be a long-term currency trade. |
Mike Carr, CMT, is a member of the Market Technicians Association, and editor of the MTA's newsletter, Technically Speaking. He is also the author of "Smarter Investing in Any Economy: The Definitive Guide to Relative Strength Investing," and "Conquering the Divide: How to Use Economic Indicators to Catch Stock Market Trends."
| Website: | www.moneynews.com/blogs/MichaelCarr/id-73 |
| E-mail address: | marketstrategist@gmail.com |
Click here for more information about our publications!
Comments
Date: 01/02/08Rank: 5Comment:

Request Information From Our Sponsors
- StockCharts.com, Inc.
- Candle Patterns
- Candlestick Charting Explained
- Intermarket Technical Analysis
- John Murphy on Chart Analysis
- John Murphy's Chart Pattern Recognition
- John Murphy's Market Message
- MurphyExplainsMarketAnalysis-Intermarket Analysis
- MurphyExplainsMarketAnalysis-Visual Analysis
- StockCharts.com
- Technical Analysis of the Financial Markets
- The Visual Investor
- VectorVest, Inc.
- Executive Premier Workshop
- One-Day Options Course
- OptionsPro
- Retirement Income Workshop
- Sure-Fire Trading Systems (VectorVest, Inc.)
- Trading as a Business Workshop
- VectorVest 7 EOD
- VectorVest 7 RealTime/IntraDay
- VectorVest AutoTester
- VectorVest Educational Services
- VectorVest OnLine
- VectorVest Options Analyzer
- VectorVest ProGraphics v6.0
- VectorVest ProTrader 7
- VectorVest RealTime Derby Tool
- VectorVest Simulator
- VectorVest Variator
- VectorVest Watchdog
