HOT TOPICS LIST
- MACD
- Fibonacci
- RSI
- Gann
- ADXR
- Stochastics
- Volume
- Triangles
- Futures
- Cycles
- Volatility
- ZIGZAG
- MESA
- Retracement
- Aroon
INDICATORS LIST
LIST OF TOPICS
PRINT THIS ARTICLE
by David Penn
Up 80% after falling to 52-week lows, Business Objects' American Depositary Receipts may have more room to run.
Position: N/A
David Penn
Technical Writer for Technical Analysis of STOCKS & COMMODITIES magazine, Working-Money.com, and Traders.com Advantage.
PRINT THIS ARTICLE
REVERSAL
Business Objects' Bump 'n' Run Reversal
02/16/01 08:07:16 AMby David Penn
Up 80% after falling to 52-week lows, Business Objects' American Depositary Receipts may have more room to run.
Position: N/A
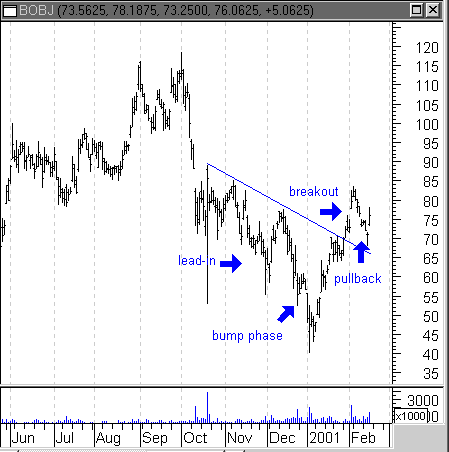
| Sure, after a stock has had a run up of 80% is probably not the cheapest time for an investor to go long. The American Depositary Receipts (ADRs) of Business Objects hit a 52-week low of 39 at the end of 2000, finishing off a drop from 120 as early as September. To those already long BOBJ, the 68% drop must have been a miserable ride. But for those looking to get in on the software maker, the fall from all-time highs last autumn seemed also to suggest a way back. |
| The bump 'n' run reversal pattern developing in BOBJ starts after the stock gapped down in early October. Prices remained in a trading range between 70 and 80 until mid-November when BOBJ dipped into the low 60s. After rallying into the low 70s in early December, BOBJ spent the rest of the month diving toward the low 40s. The mid-November and mid-December dips represent two major stages in the development of the bump 'n' run reversal, a formation that looks much like a frying pan with its handle extended to the left. |

|
| A rally from the early February pullback in this bump 'n' run reversal formation suggests that the upside breakout is for real. The upside price objective is $96. |
| Graphic provided by: MetaStock. |
| |
| The first part of the bump 'n' run reversal is called the "lead-in" and often forms the handle part of the frying pan shape. It looks like a (relatively) shallow trough that falls away from, then back to a downward trend line. The second part of the bump 'n' run reversal is called, appropriately enough, "the bump". The "bump" is a much larger trough with edges that touch the same downward trend line mentioned above. The "bump", again, should be significantly larger than the "lead-in"--twice as large is a good start. The "bump" phase tends to reflect the last wave of selling before the stock rebounds and begins to re-approach the downward trend line. |
| Pullbacks, when prices move briefly against the direction of the breakout, can be a major source of annoyance to some traders. But when it comes to spotting chart formations, a pullback is often a sign that things are going normally. Business Objects rallied almost $25 from its end of 2000 lows (a 63% advance), consolidated in the second half of January, before rising another $15 (a 21% advance). The pullback at this point most likely reflects both profit-taking by some, as well as suspicion that BOBJ's three-month downtrend may not be over. For those looking to go long BOBJ--perhaps following the bump 'n' run reversal pattern--can take advantage of the pullback to acquire shares cheaper, or wait for a post-pullback rally to signal "all-clear" for BOBJ bulls. |
| Lastly, a measurement rule for bump 'n' run reversal formations. Bulkowski recommends adding the height of the formation at the "lead-in" region to the breakout price in order to arrive at a minimum upside price objective. Applying this rule to the bump 'n' run reversal in BOBJ would give us a "lead-in" height of about 26.12. The initial breakout occurred on January 30 at $70. This would provide for a minimum upside price objective of $96.12, a 37% gain over the breakout price. |
Technical Writer for Technical Analysis of STOCKS & COMMODITIES magazine, Working-Money.com, and Traders.com Advantage.
| Title: | Technical Writer |
| Company: | Technical Analysis, Inc. |
| Address: | 4757 California Avenue SW |
| Seattle, WA 98116 | |
| Phone # for sales: | 206 938 0570 |
| Fax: | 206 938 1307 |
| Website: | www.Traders.com |
| E-mail address: | DPenn@traders.com |
Traders' Resource Links | |
| Charting the Stock Market: The Wyckoff Method -- Books | |
| Working-Money.com -- Online Trading Services | |
| Traders.com Advantage -- Online Trading Services | |
| Technical Analysis of Stocks & Commodities -- Publications and Newsletters | |
| Working Money, at Working-Money.com -- Publications and Newsletters | |
| Traders.com Advantage -- Publications and Newsletters | |
| Professional Traders Starter Kit -- Software | |
Click here for more information about our publications!
Comments

|

Request Information From Our Sponsors
- StockCharts.com, Inc.
- Candle Patterns
- Candlestick Charting Explained
- Intermarket Technical Analysis
- John Murphy on Chart Analysis
- John Murphy's Chart Pattern Recognition
- John Murphy's Market Message
- MurphyExplainsMarketAnalysis-Intermarket Analysis
- MurphyExplainsMarketAnalysis-Visual Analysis
- StockCharts.com
- Technical Analysis of the Financial Markets
- The Visual Investor
- VectorVest, Inc.
- Executive Premier Workshop
- One-Day Options Course
- OptionsPro
- Retirement Income Workshop
- Sure-Fire Trading Systems (VectorVest, Inc.)
- Trading as a Business Workshop
- VectorVest 7 EOD
- VectorVest 7 RealTime/IntraDay
- VectorVest AutoTester
- VectorVest Educational Services
- VectorVest OnLine
- VectorVest Options Analyzer
- VectorVest ProGraphics v6.0
- VectorVest ProTrader 7
- VectorVest RealTime Derby Tool
- VectorVest Simulator
- VectorVest Variator
- VectorVest Watchdog
