HOT TOPICS LIST
- MACD
- Fibonacci
- RSI
- Gann
- ADXR
- Stochastics
- Volume
- Triangles
- Futures
- Cycles
- Volatility
- ZIGZAG
- MESA
- Retracement
- Aroon
INDICATORS LIST
LIST OF TOPICS
PRINT THIS ARTICLE
by Chaitali Mohile
The health-care provider index is consolidating at the lower end followed by a huge plunge.
Position: N/A
Chaitali Mohile
Active trader in the Indian stock markets since 2003 and a full-time writer. Trading is largely based upon technical analysis.
PRINT THIS ARTICLE
CHART ANALYSIS
Health Care Provider Index Is Volatile And Range-Bound
12/31/07 10:54:18 AMby Chaitali Mohile
The health-care provider index is consolidating at the lower end followed by a huge plunge.
Position: N/A
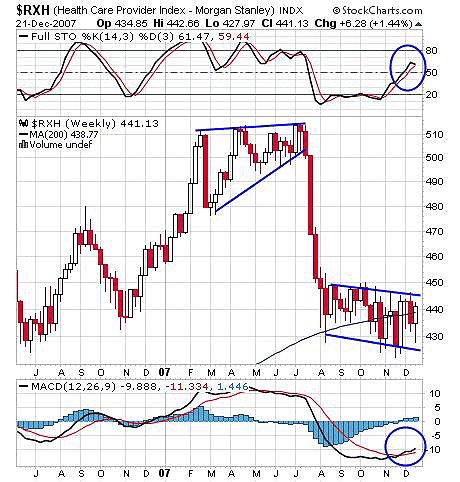
| According to the weekly chart (Figure 1), the uptrend in the health-care provider index cracked and moved downward from the triangular formation in July 2007. During this period, the entire US financial market tumbled, followed by global turbulence. Gradually, most of the indexes in the US markets recovered the lost levels and resumed the bullish rally with moderate speed. However, $RXH failed to recover its previous highs and turned sideways at lower levels. The correction dragged the index 60 points lower and thereafter consolidated in the range of 430-450. The consolidation is supposed to be healthy as a rally starts after accumulating the strength. The index is consolidating in the area of its 200-day moving average. |

|
| FIGURE 1: $RXH, DAILY. The uptrend cracked as the index broke downward from the triangular formation in July 2007. |
| Graphic provided by: StockCharts.com. |
| |
| The stochastic (14,3,3) suggests the consolidation to continue and dilutes the possibility of a breakout as the indicator is ready to decline. After the steep fall, the oscillator rallied flat for almost three months and later surged to bullish levels, but the price failed to move out of the upper range. In addition, the moving average convergence/divergence (MACD) (12,26,9) is deep in negative territory waiting for a bullish crossover. The MACD too lacks the bullish signals to initiate an upside breakout rally. So both indicators suggest the volatility will sustain and show no signs of a bullish breakout. |
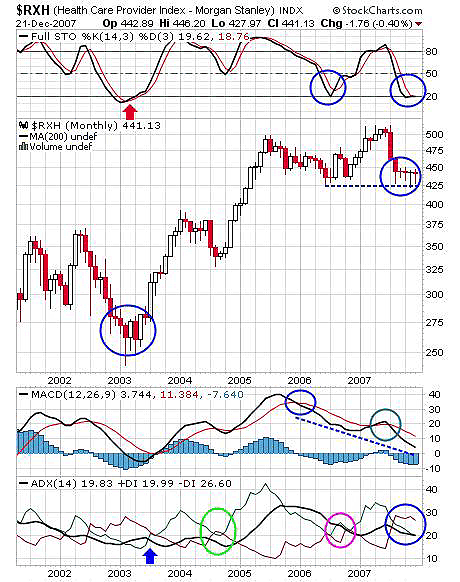
| The monthly chart (Figure 2) analysis show $RXH began its upward journey in 2003, offering buying opportunities by the stochastic moving above 20, the MACD (12,26,9) shifting to positive territory with a bullish crossover, and the average directional movement index (ADX) (14) saw an increase in buyer pressure with +DI moving above -DI. The rally here afterward was very positive with consolidation at necessary levels. The 500 levels saw some resistance and pulled the index 75 points below at 425 levels in 2006. Now, the index gets back to the same levels after the serious correction in July. The cluster of doji at this support shows the volatile trading sessions and the indecision for directional breakout. Therefore, to hold this support is of utmost importance to carry the uptrend ahead. |

|
| FIGURE 2: $RXH, MONTHLY. The index began its upward journey in 2003, offering buying opportunities. |
| Graphic provided by: StockCharts.com. |
| |
| The stochastic (12,26,9) is closer to the oversold area near 20. If it goes below 20, the price can lose its strong support. And eventually the MACD (12,26,9) that has already declined from a highly positive area may cross the zero line and shift to negative territory. Most important, if the price moves below 425, the trend may go in favor of the bears. So to sustain the bullish flavor, the index has to maintain this support and begin a new upside rally. |
| Therefore, the consolidation with support at 425 is crucial, as the breach would lead to the fresh downtrend. Trading in the equities should be avoided till the index gets in on a particular direction. |
Active trader in the Indian stock markets since 2003 and a full-time writer. Trading is largely based upon technical analysis.
| Company: | Independent |
| Address: | C1/3 Parth Indraprasth Towers. Vastrapur |
| Ahmedabad, Guj 380015 | |
| E-mail address: | chaitalimohile@yahoo.co.in |
Traders' Resource Links | |
| Independent has not added any product or service information to TRADERS' RESOURCE. | |
Click here for more information about our publications!
Comments
Date: 01/02/08Rank: 3Comment:

Request Information From Our Sponsors
- StockCharts.com, Inc.
- Candle Patterns
- Candlestick Charting Explained
- Intermarket Technical Analysis
- John Murphy on Chart Analysis
- John Murphy's Chart Pattern Recognition
- John Murphy's Market Message
- MurphyExplainsMarketAnalysis-Intermarket Analysis
- MurphyExplainsMarketAnalysis-Visual Analysis
- StockCharts.com
- Technical Analysis of the Financial Markets
- The Visual Investor
- VectorVest, Inc.
- Executive Premier Workshop
- One-Day Options Course
- OptionsPro
- Retirement Income Workshop
- Sure-Fire Trading Systems (VectorVest, Inc.)
- Trading as a Business Workshop
- VectorVest 7 EOD
- VectorVest 7 RealTime/IntraDay
- VectorVest AutoTester
- VectorVest Educational Services
- VectorVest OnLine
- VectorVest Options Analyzer
- VectorVest ProGraphics v6.0
- VectorVest ProTrader 7
- VectorVest RealTime Derby Tool
- VectorVest Simulator
- VectorVest Variator
- VectorVest Watchdog
