HOT TOPICS LIST
- MACD
- Fibonacci
- RSI
- Gann
- ADXR
- Stochastics
- Volume
- Triangles
- Futures
- Cycles
- Volatility
- ZIGZAG
- MESA
- Retracement
- Aroon
INDICATORS LIST
LIST OF TOPICS
PRINT THIS ARTICLE
by Arthur Hill
Trading has turned boring for Research In Motion as the stock consolidates between a rock (support) and a hard place (resistance). The direction of the break will dictate the next signal.
Position: Hold
Arthur Hill
Arthur Hill is currently editor of TDTrader.com, a website specializing in trading strategies, sector/industry specific breadth stats and overall technical analysis. He passed the Society of Technical Analysts (STA London) diploma exam with distinction is a Certified Financial Technician (CFTe). Prior to TD Trader, he was the Chief Technical Analyst for Stockcharts.com and the main contributor to the ChartSchool.
PRINT THIS ARTICLE
RETRACEMENT
RIMM Gets Boring
12/21/07 10:05:44 AMby Arthur Hill
Trading has turned boring for Research In Motion as the stock consolidates between a rock (support) and a hard place (resistance). The direction of the break will dictate the next signal.
Position: Hold
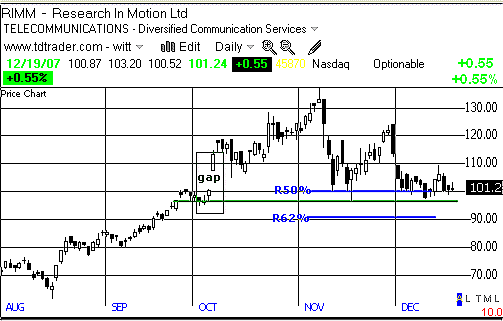
| Figure 1 outlines the case for support around 99. The stock bounced off the 98-100 area at least three times in two months. There were two bounces in November and one in December. These bounces point to demand around 98-100 and reinforce this support area. |

|
| FIGURE 1: RIMM, DAILY. Here's the case for support around 99. |
| Graphic provided by: TeleChart2007. |
| |
| In addition to the reaction lows, RIMM is finding support from the October gap and a key retracement. The stock surged over 60 points from August to early November without a pullback. The sharp November pullback retraced 50% of that advance and found support near the early October gap; 50% is normal for a retracement in an uptrend. |
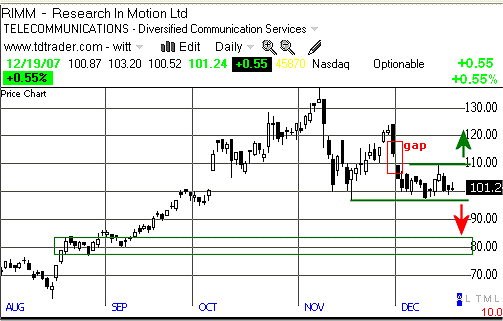
| Now that we have established support, it is time to check on resistance for a breakout signal. After the November decline, RIMM consolidated for three weeks in December. There was a two-day turn last week, but RIMM met resistance from the gap and 110 is the level to beat. A break above 110 would solidify support and put RIMM back in bull mode. A test of the November highs would then be in order. See Figure 2. |

|
| FIGURE 2: RIMM, DAILY. RIMM consolidated for three weeks in December after the November decline. |
| Graphic provided by: TeleChart2007. |
| |
| Should the stock fail at resistance, a break below consolidation support would signal a continuation of the prior decline. The next support area is around 80 and this would be the first target. |
Arthur Hill is currently editor of TDTrader.com, a website specializing in trading strategies, sector/industry specific breadth stats and overall technical analysis. He passed the Society of Technical Analysts (STA London) diploma exam with distinction is a Certified Financial Technician (CFTe). Prior to TD Trader, he was the Chief Technical Analyst for Stockcharts.com and the main contributor to the ChartSchool.
| Title: | Editor |
| Company: | TDTrader.com |
| Address: | Willem Geetsstraat 17 |
| Mechelen, B2800 | |
| Phone # for sales: | 3215345465 |
| Website: | www.tdtrader.com |
| E-mail address: | arthurh@tdtrader.com |
Traders' Resource Links | |
| TDTrader.com has not added any product or service information to TRADERS' RESOURCE. | |
Click here for more information about our publications!
Comments
Date: 12/23/07Rank: 5Comment:
Date: 12/23/07Rank: 4Comment:

|

Request Information From Our Sponsors
- VectorVest, Inc.
- Executive Premier Workshop
- One-Day Options Course
- OptionsPro
- Retirement Income Workshop
- Sure-Fire Trading Systems (VectorVest, Inc.)
- Trading as a Business Workshop
- VectorVest 7 EOD
- VectorVest 7 RealTime/IntraDay
- VectorVest AutoTester
- VectorVest Educational Services
- VectorVest OnLine
- VectorVest Options Analyzer
- VectorVest ProGraphics v6.0
- VectorVest ProTrader 7
- VectorVest RealTime Derby Tool
- VectorVest Simulator
- VectorVest Variator
- VectorVest Watchdog
- StockCharts.com, Inc.
- Candle Patterns
- Candlestick Charting Explained
- Intermarket Technical Analysis
- John Murphy on Chart Analysis
- John Murphy's Chart Pattern Recognition
- John Murphy's Market Message
- MurphyExplainsMarketAnalysis-Intermarket Analysis
- MurphyExplainsMarketAnalysis-Visual Analysis
- StockCharts.com
- Technical Analysis of the Financial Markets
- The Visual Investor
