HOT TOPICS LIST
- MACD
- Fibonacci
- RSI
- Gann
- ADXR
- Stochastics
- Volume
- Triangles
- Futures
- Cycles
- Volatility
- ZIGZAG
- MESA
- Retracement
- Aroon
INDICATORS LIST
LIST OF TOPICS
PRINT THIS ARTICLE
by Chaitali Mohile
The downslope continues for Japan iShares. So where will be the support established?
Position: N/A
Chaitali Mohile
Active trader in the Indian stock markets since 2003 and a full-time writer. Trading is largely based upon technical analysis.
PRINT THIS ARTICLE
SUPPORT & RESISTANCE
Where Will Support For Japan iShares Be Established?
12/21/07 12:47:06 PMby Chaitali Mohile
The downslope continues for Japan iShares. So where will be the support established?
Position: N/A
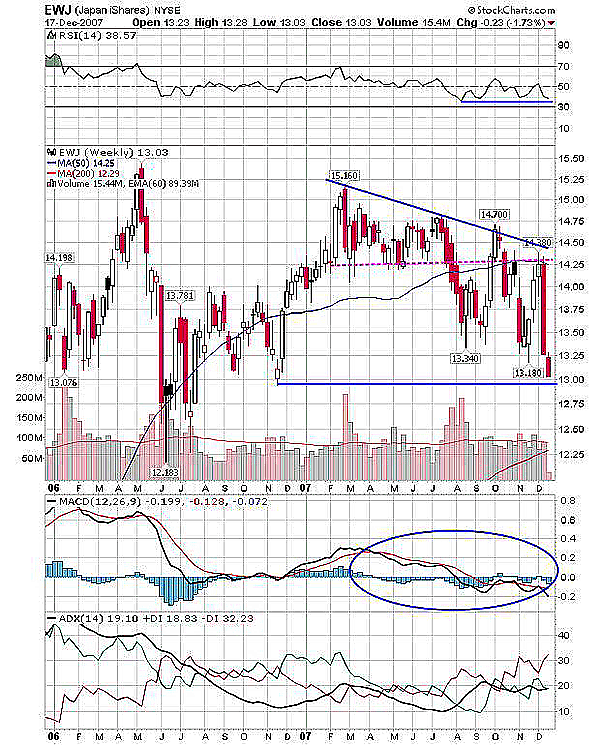
| Japan iShares (EWJ) continues to tumble on weak global cues, and moved lower than the likely support line. In Figure 1 the second high pivot was at 15.160, and then EWJ formed lower highs, allowing trading opportunities in between. This action created many support and resistance zones, which turned strong hurdles to any directional movement. The trendline coincides with a 50-day moving average resistance at approximately 14.25 levels. In addition, the support line that was violated by the mid-July correction was another resistance line for a current pullback. This resistance line also falls at 14.25 and therefore becomes the strong resistance for a future rally. |

|
| FIGURE 1: EWJ, WEEKLY. Below the support of 13.00, the next support stands at 12.25 and 12.18. The RSI (14) is below 50 and is neutral at 38. |
| Graphic provided by: StockCharts.com. |
| |
| With this resistance, EWJ made two lower lows at 13.34 and 13.18, but the recent plunge of December 17 dragged the iShares lower to the previous support. With such a bearish mark, where can we expect a bottom formation or the bounceback rally? The weekly chart shows the lowest support at approximately 13.00; establishing support at 13.00 is important to protect the bulls. Similarly, the moving average convergence/divergence (MACD) (12,26,9) too has lower highs and was volatile near the trigger line, resisting the price to move either way. |
| The average directional movement index (ADX) (14) above 20 would show a developing downtrend as the negative directional index -DI is ruling above +DI. So holding the support of 13.00 is essential to bring back the bulls. |

|
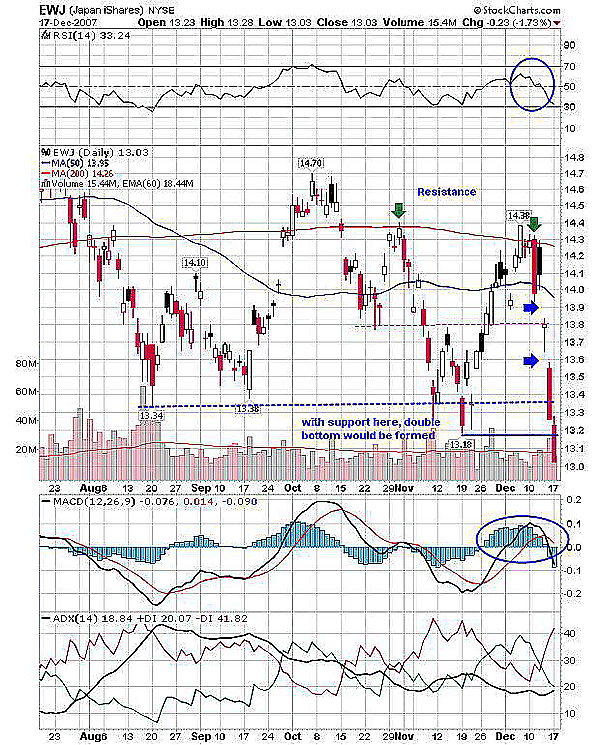
| FIGURE 2: EWJ, DAILY. EWJ failed to hold support at 13.18. |
| Graphic provided by: StockCharts.com. |
| |
| In Figure 2, the series of supports are now resistance for the EWJ rally. After the high at 14.70, the long-term moving average (200-day) kept the price under pressure, since earlier on November 19 the price hit the low at 13.18 and then retested the 200-day MA resistance. The large gaps down since then turned out to be a nightmare for traders as genuine support was taken out and the fall continued. I thought the double bottom support at 13.18 was established. Instead, the stock rushed below the support level with no sign of pullback. |
| The MACD (12,26,9) is negative, and the ADX (14) has more selling pressure so the ADX above 20 would show a developing downtrend. And the relative strength index (RSI) (14) is below its bullish level. So indicators have a bearish bias on both charts; if some stability comes across the global market, support at 13.00 is possible and a bottom formation can be expected. |
Active trader in the Indian stock markets since 2003 and a full-time writer. Trading is largely based upon technical analysis.
| Company: | Independent |
| Address: | C1/3 Parth Indraprasth Towers. Vastrapur |
| Ahmedabad, Guj 380015 | |
| E-mail address: | chaitalimohile@yahoo.co.in |
Traders' Resource Links | |
| Independent has not added any product or service information to TRADERS' RESOURCE. | |
Click here for more information about our publications!
Comments
Date: 12/23/07Rank: 4Comment:

Request Information From Our Sponsors
- VectorVest, Inc.
- Executive Premier Workshop
- One-Day Options Course
- OptionsPro
- Retirement Income Workshop
- Sure-Fire Trading Systems (VectorVest, Inc.)
- Trading as a Business Workshop
- VectorVest 7 EOD
- VectorVest 7 RealTime/IntraDay
- VectorVest AutoTester
- VectorVest Educational Services
- VectorVest OnLine
- VectorVest Options Analyzer
- VectorVest ProGraphics v6.0
- VectorVest ProTrader 7
- VectorVest RealTime Derby Tool
- VectorVest Simulator
- VectorVest Variator
- VectorVest Watchdog
- StockCharts.com, Inc.
- Candle Patterns
- Candlestick Charting Explained
- Intermarket Technical Analysis
- John Murphy on Chart Analysis
- John Murphy's Chart Pattern Recognition
- John Murphy's Market Message
- MurphyExplainsMarketAnalysis-Intermarket Analysis
- MurphyExplainsMarketAnalysis-Visual Analysis
- StockCharts.com
- Technical Analysis of the Financial Markets
- The Visual Investor
