HOT TOPICS LIST
- MACD
- Fibonacci
- RSI
- Gann
- ADXR
- Stochastics
- Volume
- Triangles
- Futures
- Cycles
- Volatility
- ZIGZAG
- MESA
- Retracement
- Aroon
INDICATORS LIST
LIST OF TOPICS
PRINT THIS ARTICLE
by Chaitali Mohile
During the September to November price movement, the North American Telecommunication Index formed a rounded top -- a rare event.
Position: N/A
Chaitali Mohile
Active trader in the Indian stock markets since 2003 and a full-time writer. Trading is largely based upon technical analysis.
PRINT THIS ARTICLE
ROUND TOP & BOTTOM
The Rounded Top Of $XTC
12/21/07 12:36:38 PMby Chaitali Mohile
During the September to November price movement, the North American Telecommunication Index formed a rounded top -- a rare event.
Position: N/A
| The round top is a bearish formation that indicates the change of the current uptrend to down. After a consistent climb, the buying of a particular stock becomes exhausted, affecting the strength of the uptrend too. Eventually, selling gets stronger and drags the price below the support line. For a rounded top, the breakthrough from the moving average is considered a confirmation breakout, so the moving average is important here. The pattern is dome-shaped and sometimes resembles an inverted bowl or a saucer. |
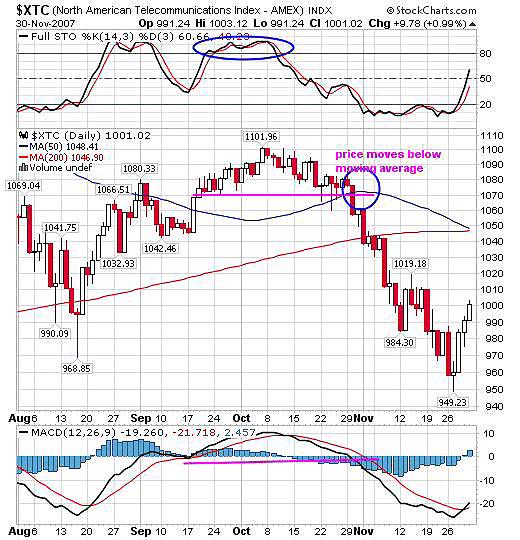
| In Figure 1, the index rallied from 968 to 1101 in the time span of a month and half. But as the move turned volatile, the resistance of a 50-day simple moving average was crossed. The index declined from the higher level at 1101 and slipped below the 50-day MA support. The rounded top that formed was the trend change warning for the traders. |

|
| FIGURE 1: $XTC, DAILY. The round top dragged the price far below the estimated level. |
| Graphic provided by: StockCharts.com. |
| |
| The pattern that takes a longer time to complete gives a more significant breakout. The pattern in this instance was completed in four to six weeks and also gave a strong breakout offering selling opportunities. To identify better trading, let's consider the indicators on the chart too. Usually, a rounded top breaking below the moving average is a definite breakout and traders can enter short positions here. But other indicators should also provide confirmation. The relative strength index (RSI) (14) was overbought and unstable, indicating reducing strength for a bullish rally. And the indicator declined steeply; in addition, the moving average convergence/divergence (MACD) (12,26,9) had a bearish crossover. |
| Therefore, considering both indicators had bearish signs, a short trade was possible below 1070. There is no specific formula to measure the target on this pattern, but roughly the distance between the support line from left to the peak can be calculated to identify the downside levels. So we can measure that as 1101 - 1070 = 31. Therefore, subtracting 31 from the breakout at 1070 gives us a target of 1039. The index consolidated too as the target was achieved. But on weaker cues the downside journey continued and hit lower lows, fattening traders' pockets. |
Active trader in the Indian stock markets since 2003 and a full-time writer. Trading is largely based upon technical analysis.
| Company: | Independent |
| Address: | C1/3 Parth Indraprasth Towers. Vastrapur |
| Ahmedabad, Guj 380015 | |
| E-mail address: | chaitalimohile@yahoo.co.in |
Traders' Resource Links | |
| Independent has not added any product or service information to TRADERS' RESOURCE. | |
Click here for more information about our publications!
Comments
Date: 12/23/07Rank: 4Comment:

Request Information From Our Sponsors
- StockCharts.com, Inc.
- Candle Patterns
- Candlestick Charting Explained
- Intermarket Technical Analysis
- John Murphy on Chart Analysis
- John Murphy's Chart Pattern Recognition
- John Murphy's Market Message
- MurphyExplainsMarketAnalysis-Intermarket Analysis
- MurphyExplainsMarketAnalysis-Visual Analysis
- StockCharts.com
- Technical Analysis of the Financial Markets
- The Visual Investor
- VectorVest, Inc.
- Executive Premier Workshop
- One-Day Options Course
- OptionsPro
- Retirement Income Workshop
- Sure-Fire Trading Systems (VectorVest, Inc.)
- Trading as a Business Workshop
- VectorVest 7 EOD
- VectorVest 7 RealTime/IntraDay
- VectorVest AutoTester
- VectorVest Educational Services
- VectorVest OnLine
- VectorVest Options Analyzer
- VectorVest ProGraphics v6.0
- VectorVest ProTrader 7
- VectorVest RealTime Derby Tool
- VectorVest Simulator
- VectorVest Variator
- VectorVest Watchdog
