HOT TOPICS LIST
- MACD
- Fibonacci
- RSI
- Gann
- ADXR
- Stochastics
- Volume
- Triangles
- Futures
- Cycles
- Volatility
- ZIGZAG
- MESA
- Retracement
- Aroon
INDICATORS LIST
LIST OF TOPICS
PRINT THIS ARTICLE
by Chaitali Mohile
After an extensive panic selling, the Hang Seng has formed another bearish reversal pattern of an evening doji star in the last three weeks.
Position: Sell
Chaitali Mohile
Active trader in the Indian stock markets since 2003 and a full-time writer. Trading is largely based upon technical analysis.
PRINT THIS ARTICLE
CANDLESTICK CHARTING
$HSI Is In A Panic
12/20/07 09:54:35 AMby Chaitali Mohile
After an extensive panic selling, the Hang Seng has formed another bearish reversal pattern of an evening doji star in the last three weeks.
Position: Sell
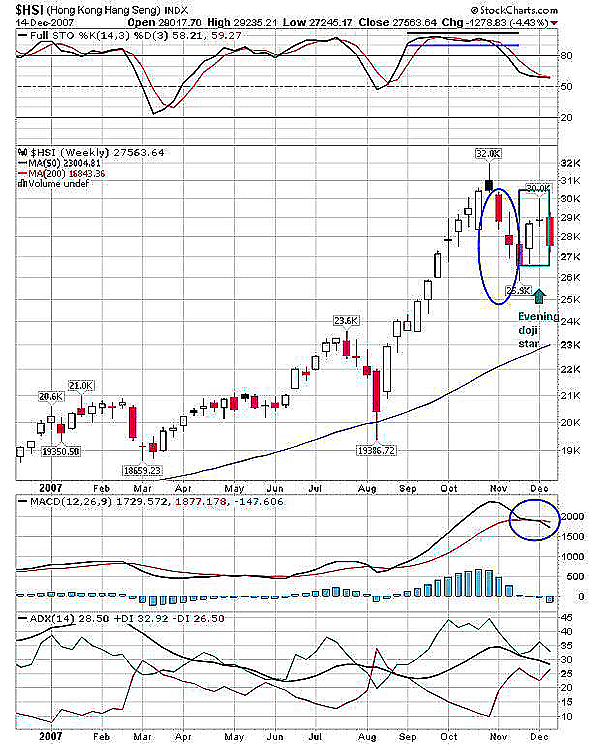
| Over the past few weeks, global turbulence has dragged many of the strong financial markets to their lower support levels creating panic all round. The Hang Seng a benchmark of the Asian markets, faced panic selling in three consecutive weeks in early November. This panic selling on the weekly chart (Figure 1) gave us the view of identical three crows. The marked circle in Figure 1 shows the candles falling down in a staircase. Each day opened at the previous day's close; the middle candle traded much lower but managed to close above the lowest pivot of the day. And the following day started at the second day's close. |
| The pattern suggests panic selling and warns of a further fall. In addition, the stochastic (14,3,3) rallied flat at an overbought level for quite some time. This means the market has topped out and a correction is under way. The panick selling in the following weeks confirmed the signal. The oscillator has now left behind the overbought levels and is around the 58-59 areas. |

|
| FIGURE 1: $HSI, WEEKLY. The correction has an immediate support at 25,900.The MACD (12,26,9) has a bearish crossover in positive territory. |
| Graphic provided by: StockCharts.com. |
| |
| The next three weeks following the identical three crows, saw the formation of another strong bearish reversal signal in the shape of an evening doji star. The pattern becomes stronger due to the doji star that is formed between the bullish candle of the present trend and the bearish candle of the changing trend. Since the pattern is strong by itself no confirmation is necessary, and therefore the Hong Kong Index is likely to see further freefall on the back of this reversal pattern. Yes, the index fell almost 3.51% today, closing at 26,596.58. $HSI is likely to drift further along with global markets; the immediate support is approximately at 25,900. The charts keep us informed about the technical storms in the markets. |
| This is the bull market that ought to give hiccups. Even after such a severe fall, the average directional movement Index (ADX) in Figure 1 shows a strong uptrend with some reduced pressure from buyers. There are possibilities of positive and negative directional index numbers clashing till the lower price support is hit. In addition, the moving average convergence/divergence (MACD) is at a peak in positive territory but now has shifted below its trigger line. The MACD (12,26,9) points at a short-term corrective rally that can be a good selling opportunity till the price hits its lower pivot. |
| In a bull market every correction offers healthy buying, but at present we need to be patient before entering any long trade. The chart currently has bearish signs, so be watchful till good support is established on the index, and global stability can be seen. |
Active trader in the Indian stock markets since 2003 and a full-time writer. Trading is largely based upon technical analysis.
| Company: | Independent |
| Address: | C1/3 Parth Indraprasth Towers. Vastrapur |
| Ahmedabad, Guj 380015 | |
| E-mail address: | chaitalimohile@yahoo.co.in |
Traders' Resource Links | |
| Independent has not added any product or service information to TRADERS' RESOURCE. | |
Click here for more information about our publications!
Comments
Date: 12/20/07Rank: 5Comment:

Request Information From Our Sponsors
- StockCharts.com, Inc.
- Candle Patterns
- Candlestick Charting Explained
- Intermarket Technical Analysis
- John Murphy on Chart Analysis
- John Murphy's Chart Pattern Recognition
- John Murphy's Market Message
- MurphyExplainsMarketAnalysis-Intermarket Analysis
- MurphyExplainsMarketAnalysis-Visual Analysis
- StockCharts.com
- Technical Analysis of the Financial Markets
- The Visual Investor
- VectorVest, Inc.
- Executive Premier Workshop
- One-Day Options Course
- OptionsPro
- Retirement Income Workshop
- Sure-Fire Trading Systems (VectorVest, Inc.)
- Trading as a Business Workshop
- VectorVest 7 EOD
- VectorVest 7 RealTime/IntraDay
- VectorVest AutoTester
- VectorVest Educational Services
- VectorVest OnLine
- VectorVest Options Analyzer
- VectorVest ProGraphics v6.0
- VectorVest ProTrader 7
- VectorVest RealTime Derby Tool
- VectorVest Simulator
- VectorVest Variator
- VectorVest Watchdog
