HOT TOPICS LIST
- MACD
- Fibonacci
- RSI
- Gann
- ADXR
- Stochastics
- Volume
- Triangles
- Futures
- Cycles
- Volatility
- ZIGZAG
- MESA
- Retracement
- Aroon
INDICATORS LIST
LIST OF TOPICS
PRINT THIS ARTICLE
by Mike Carr, CMT
After earning a very small profit on a seasonal Thanksgiving trade, we look at how to profit from Wall Street's legendary holiday bullishness.
Position: Buy
Mike Carr, CMT
Mike Carr, CMT, is a member of the Market Technicians Association, and editor of the MTA's newsletter, Technically Speaking. He is also the author of "Smarter Investing in Any Economy: The Definitive Guide to Relative Strength Investing," and "Conquering the Divide: How to Use Economic Indicators to Catch Stock Market Trends."
PRINT THIS ARTICLE
SEASONAL TRADING
Buying The Santa Claus Rally
12/10/07 02:26:43 PMby Mike Carr, CMT
After earning a very small profit on a seasonal Thanksgiving trade, we look at how to profit from Wall Street's legendary holiday bullishness.
Position: Buy
| "Everyone" knows that stocks do well at the end of the year. Some analysts attribute this to window-dressing by mutual funds who want their shareholders to believe they own the year's biggest winners. To implement this strategy, the theory goes, they buy the year's best performers so that their annual report will show a position in that strong. Whether or not this is actually done is debatable. Other analysts think strong end-of-year performance is due to investors getting a jump on the well-known January effect in small-cap stocks, where shares of smaller companies typically outperform the overall market. The only thing we know for sure about the markets is that following conventional wisdom can be dangerous to our wealth. So we put the Santa Claus rally to the test, looking for profitable holding periods in December. |
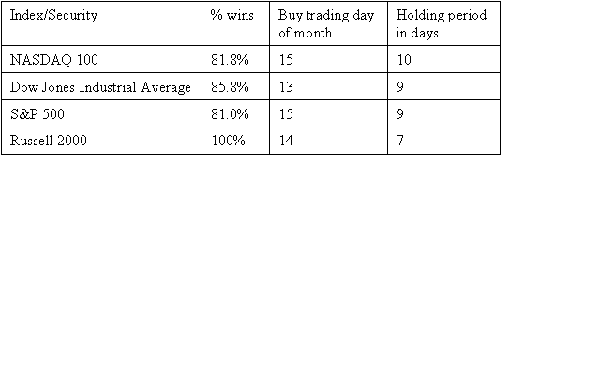
| Seasonal trades involve identifying the best days to buy and sell during a certain time frame. In this case, we'll look at buying on any trading day in December and vary the holding period from one day to four weeks. We'll define the best seasonal strategy to be the one with the largest winning percentage of trades. The results for several indexes are shown in Figure 1. |

|
| FIGURE 1: INDEX RESULTS. The results for several indexes can be seen here. |
| Graphic provided by: Microsoft Excel. |
| |
| While many analysts test seasonal strategies on calendar days, we used trading days. The trading day of the month counts only trading days. So if the month begins on a Sunday, the first trading day of the month would be the second calendar day of the month. This seems to provide more consistent results in backtesting seasonal strategies. Figure 1 shows that we could consistently profit by buying in mid-December and selling after two weeks or less. The Dow Jones Industrial Average (DJIA) has the longest available history of any index, and over 106 years, this strategy was profitable. Very few trading ideas have such a long track record. |
| To implement the strategy, we could use ETFs, like the QQQQ for the NASDAQ 100. The QQQQs have been trading for 17 years, and this strategy would have led to 15 profitable trades, using a holding period of only seven days. Overall, the average trade returned 3.5%, with a maximum gain of 13.3% in 1991. The largest loss was -3.3% in 1996. By dollars, trading 100 shares, the largest loss was less than $70 in 1996, and the largest profit would have been more than $1,100 in 1999. |
| Although Figure 1 might tempt traders to use IWM, the Russell 2000 ETF, because of the higher winning percentage, the average profit per trade is only 2.9%. Not a bad return, but less than the QQQQs. Aggressive traders can use QQQQ options, single stock futures, or the Ultra QQQ ProShares (QLD) which offers leverage to stock traders. This ETF uses futures and options seeking to attain performance that corresponds to twice the daily performance of the NASDAQ 100 Index. This year, buying on the open on December 21 and selling the open on January 3 is a high probability trade. |
Mike Carr, CMT, is a member of the Market Technicians Association, and editor of the MTA's newsletter, Technically Speaking. He is also the author of "Smarter Investing in Any Economy: The Definitive Guide to Relative Strength Investing," and "Conquering the Divide: How to Use Economic Indicators to Catch Stock Market Trends."
| Website: | www.moneynews.com/blogs/MichaelCarr/id-73 |
| E-mail address: | marketstrategist@gmail.com |
Click here for more information about our publications!
PRINT THIS ARTICLE

Request Information From Our Sponsors
- StockCharts.com, Inc.
- Candle Patterns
- Candlestick Charting Explained
- Intermarket Technical Analysis
- John Murphy on Chart Analysis
- John Murphy's Chart Pattern Recognition
- John Murphy's Market Message
- MurphyExplainsMarketAnalysis-Intermarket Analysis
- MurphyExplainsMarketAnalysis-Visual Analysis
- StockCharts.com
- Technical Analysis of the Financial Markets
- The Visual Investor
- VectorVest, Inc.
- Executive Premier Workshop
- One-Day Options Course
- OptionsPro
- Retirement Income Workshop
- Sure-Fire Trading Systems (VectorVest, Inc.)
- Trading as a Business Workshop
- VectorVest 7 EOD
- VectorVest 7 RealTime/IntraDay
- VectorVest AutoTester
- VectorVest Educational Services
- VectorVest OnLine
- VectorVest Options Analyzer
- VectorVest ProGraphics v6.0
- VectorVest ProTrader 7
- VectorVest RealTime Derby Tool
- VectorVest Simulator
- VectorVest Variator
- VectorVest Watchdog
