HOT TOPICS LIST
- MACD
- Fibonacci
- RSI
- Gann
- ADXR
- Stochastics
- Volume
- Triangles
- Futures
- Cycles
- Volatility
- ZIGZAG
- MESA
- Retracement
- Aroon
INDICATORS LIST
LIST OF TOPICS
PRINT THIS ARTICLE
by Chaitali Mohile
FCN Consulting had bearish reversal signals on its weekly chart while three black crows were developing.
Position: N/A
Chaitali Mohile
Active trader in the Indian stock markets since 2003 and a full-time writer. Trading is largely based upon technical analysis.
PRINT THIS ARTICLE
CANDLESTICK CHARTING
FTI Consulting Forms Three Black Crows
12/07/07 02:33:06 PMby Chaitali Mohile
FCN Consulting had bearish reversal signals on its weekly chart while three black crows were developing.
Position: N/A
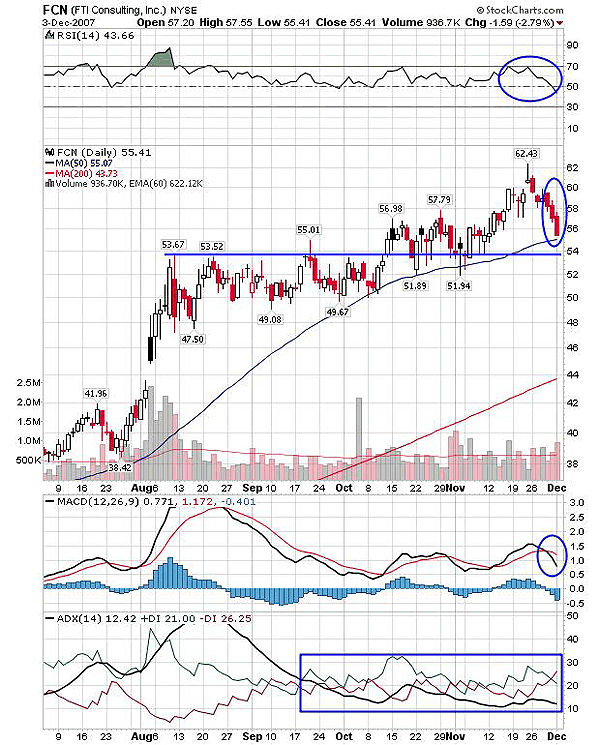
| The three black crow formation is a bearish reversal candlestick pattern warning of a trend reversal signal in the near term. The formation usually appears while the stock/index is approaching a top or remains at high levels for some time. FCN rallied consistently in one direction for some time, making an all-time high at $62. The stock formed three black crows after marking an all-time high level at $62. While the pattern was forming, the stock opened slightly higher than the previous day's close but closed to new lows, thus forming a lower low and lower high. FCN has two support levels at approximately 55-54 levels that can prevent further downfall. |
| The relative strength index (RSI) (14) plunged below the 50 level (marginally). If price establishes support at the above-mentioned levels, then strength can turn bullish again. The moving average convergence/divergence (MACD) (12,26,9) has a bearish crossover in positive territory. So both the indicators still have bullish support suggesting there could be a resistance to a further price downfall. The average directional movement index ADX (14) tells a different story. The trend is under severe pressure from bulls and bears. It is too weak to favor either bulls or bears. The ADX (14) has declined to 12 from overheated levels. And on back of this weak trend, FCN made all-time high. So we might see some consolidation while the price approaches the higher levels again. |

|
| FIGURE 1, FCN, DAILY. With support of the 55–54 level upside rally may regain the strength to hit the previous high. The rally may witness some volatility. |
| Graphic provided by: StockCharts.com. |
| |
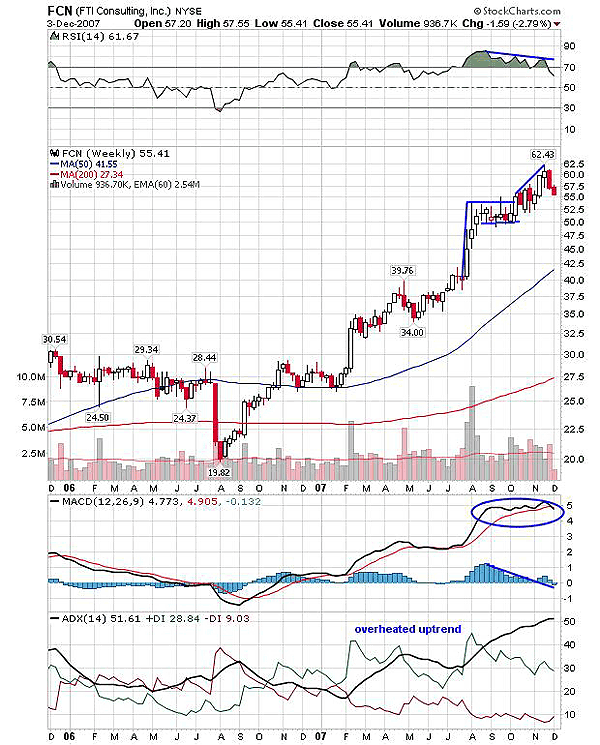
| Figure 2 displayed a bearish sign before the plunge. There was a flag and pennant breakout and prices were on their way to their target of 64. The target is simple to calculate. Just measure the height of the flag pole (52-40), and add it to the breakout level of 52. While the price was heading higher, the RSI (14) showed a negative divergence, indicating the possibility of a downside rally. The MACD histogram also displayed a negative divergence. The two together might put pressure on upside strength and hold back the stock from hitting its target. |

|
| FIGURE 2: FCN, WEEKLY. The negative divergence on RSI (14), histogram, and overheated uptrend obstructed the bullish path. |
| Graphic provided by: StockCharts.com. |
| |
| The MACD (12,26,9) has moved deep in the positive area, which means a bearish crossover is likely. In addition, the ADX (14) is at 51, indicating an overheated uptrend. The time period for reversal movement is always difficult to measure so we need to follow the signals and be alert. |
| Under these bearish signals an intermediate-trend change is possible. The stock has strong support that could lead the rally back to its higher levels. |
Active trader in the Indian stock markets since 2003 and a full-time writer. Trading is largely based upon technical analysis.
| Company: | Independent |
| Address: | C1/3 Parth Indraprasth Towers. Vastrapur |
| Ahmedabad, Guj 380015 | |
| E-mail address: | chaitalimohile@yahoo.co.in |
Traders' Resource Links | |
| Independent has not added any product or service information to TRADERS' RESOURCE. | |
Click here for more information about our publications!
Comments
Date: 12/08/07Rank: 2Comment:
Date: 12/09/07Rank: 5Comment: Thanks.
Stanley Okun

Request Information From Our Sponsors
- VectorVest, Inc.
- Executive Premier Workshop
- One-Day Options Course
- OptionsPro
- Retirement Income Workshop
- Sure-Fire Trading Systems (VectorVest, Inc.)
- Trading as a Business Workshop
- VectorVest 7 EOD
- VectorVest 7 RealTime/IntraDay
- VectorVest AutoTester
- VectorVest Educational Services
- VectorVest OnLine
- VectorVest Options Analyzer
- VectorVest ProGraphics v6.0
- VectorVest ProTrader 7
- VectorVest RealTime Derby Tool
- VectorVest Simulator
- VectorVest Variator
- VectorVest Watchdog
- StockCharts.com, Inc.
- Candle Patterns
- Candlestick Charting Explained
- Intermarket Technical Analysis
- John Murphy on Chart Analysis
- John Murphy's Chart Pattern Recognition
- John Murphy's Market Message
- MurphyExplainsMarketAnalysis-Intermarket Analysis
- MurphyExplainsMarketAnalysis-Visual Analysis
- StockCharts.com
- Technical Analysis of the Financial Markets
- The Visual Investor
