HOT TOPICS LIST
- MACD
- Fibonacci
- RSI
- Gann
- ADXR
- Stochastics
- Volume
- Triangles
- Futures
- Cycles
- Volatility
- ZIGZAG
- MESA
- Retracement
- Aroon
INDICATORS LIST
LIST OF TOPICS
PRINT THIS ARTICLE
by Mike Carr, CMT
As this stock moves out of a long-term base, shareholders may enjoy long-term profits from this diversified company.
Position: Buy
Mike Carr, CMT
Mike Carr, CMT, is a member of the Market Technicians Association, and editor of the MTA's newsletter, Technically Speaking. He is also the author of "Smarter Investing in Any Economy: The Definitive Guide to Relative Strength Investing," and "Conquering the Divide: How to Use Economic Indicators to Catch Stock Market Trends."
PRINT THIS ARTICLE
REL. STR COMPARATIVE
Walter Industries, With Buying Based On The Long-Term View
12/06/07 12:04:36 PMby Mike Carr, CMT
As this stock moves out of a long-term base, shareholders may enjoy long-term profits from this diversified company.
Position: Buy
| Technical analysts often focus only on the short term, relying on daily and intraday charts to form their opinion on a stock. Stepping back and looking at weekly charts can help traders identify core holdings, positions that can be held for months of steady gains and that stabilize the ups and downs associated with short-term trading. |
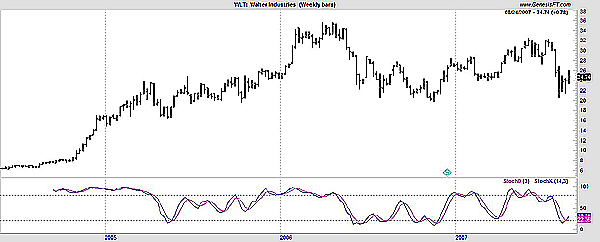
| Walter Industries (WLT) describes itself as a diversified company, a "significant producer of high-quality metallurgical coal and natural gas for worldwide markets and also a leader in affordable homebuilding and financing." Until December 2006, WLT was also the majority shareholder of a water infrastructure company, but it spun off its holdings in what some data providers consider to be a 2 to 1 stock split while others failed to adjust the price, showing a 50% drop in price. Interestingly, the overall pattern looks the same with or without the adjustment -- a two-year basing pattern (Figure 1). |

|
| FIGURE 1: WALTER INDUSTRIALS, WEEKLY. Here, WLT shows a recent stochastic buy signal. |
| Graphic provided by: Trade Navigator. |
| |
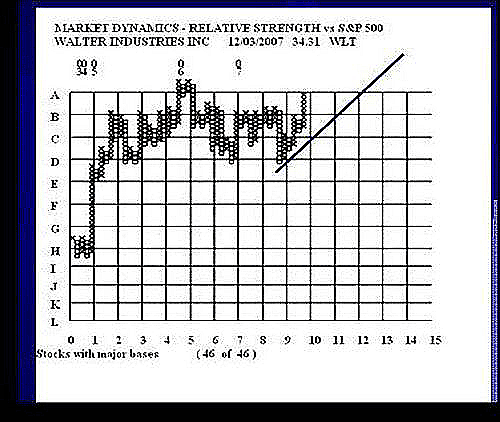
| The recent stochastics buy signal on the weekly chart, combined with the basing pattern, makes WLT worth taking a look at. An additional bullish factor that was highlighted by Clay Allen, founder of Market Dynamics, is that the stock is a buy based upon a recent breakout in the point & figure chart of its relative strength (Figure 2). |

|
| FIGURE 2: WLT, POINT & FIGURE. This chart shows the relative strength of the stock. |
| Graphic provided by: Market Dynamics (www.clayallen.com). |
| |
| Figure 2 shows the relative strength of WLT plotted in point & figure format. By reducing the market noise of daily movements, this chart makes it easier to spot the trend. WLT's relative strength is clearly in an uptrend after moving out of a base that lasted more than a year. This breakout can give added confidence to traders in WLT. |
| Based upon the long-term technical picture, WLT represents a good buy. The bottom of the base, near 20, offers a good point to place a stop. |
Mike Carr, CMT, is a member of the Market Technicians Association, and editor of the MTA's newsletter, Technically Speaking. He is also the author of "Smarter Investing in Any Economy: The Definitive Guide to Relative Strength Investing," and "Conquering the Divide: How to Use Economic Indicators to Catch Stock Market Trends."
| Website: | www.moneynews.com/blogs/MichaelCarr/id-73 |
| E-mail address: | marketstrategist@gmail.com |
Click here for more information about our publications!
Comments
Date: 12/07/07Rank: 4Comment:

Request Information From Our Sponsors
- StockCharts.com, Inc.
- Candle Patterns
- Candlestick Charting Explained
- Intermarket Technical Analysis
- John Murphy on Chart Analysis
- John Murphy's Chart Pattern Recognition
- John Murphy's Market Message
- MurphyExplainsMarketAnalysis-Intermarket Analysis
- MurphyExplainsMarketAnalysis-Visual Analysis
- StockCharts.com
- Technical Analysis of the Financial Markets
- The Visual Investor
- VectorVest, Inc.
- Executive Premier Workshop
- One-Day Options Course
- OptionsPro
- Retirement Income Workshop
- Sure-Fire Trading Systems (VectorVest, Inc.)
- Trading as a Business Workshop
- VectorVest 7 EOD
- VectorVest 7 RealTime/IntraDay
- VectorVest AutoTester
- VectorVest Educational Services
- VectorVest OnLine
- VectorVest Options Analyzer
- VectorVest ProGraphics v6.0
- VectorVest ProTrader 7
- VectorVest RealTime Derby Tool
- VectorVest Simulator
- VectorVest Variator
- VectorVest Watchdog
