HOT TOPICS LIST
- MACD
- Fibonacci
- RSI
- Gann
- ADXR
- Stochastics
- Volume
- Triangles
- Futures
- Cycles
- Volatility
- ZIGZAG
- MESA
- Retracement
- Aroon
INDICATORS LIST
LIST OF TOPICS
PRINT THIS ARTICLE
by Chaitali Mohile
The entire technology sector is under pressure, and Dell is no exception. The stock formed an evening star formation with a huge gap down.
Position: N/A
Chaitali Mohile
Active trader in the Indian stock markets since 2003 and a full-time writer. Trading is largely based upon technical analysis.
PRINT THIS ARTICLE
CORRELATION ANALYSIS
Dell Inc. Forms Evening Star
12/07/07 01:33:33 PMby Chaitali Mohile
The entire technology sector is under pressure, and Dell is no exception. The stock formed an evening star formation with a huge gap down.
Position: N/A
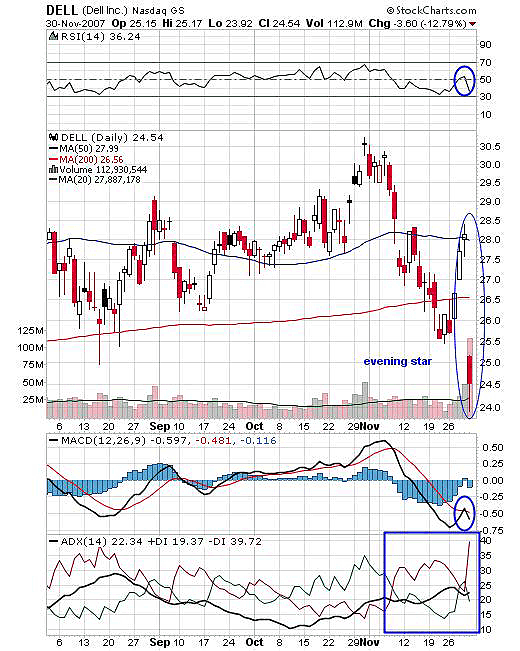
| The evening star is bearish reversal pattern and appears during an uptrend. The pattern is formed by three candlesticks, and one is the doji, which has an important role. Dell started its bullish journey from $25.50 gaining $3 on the rally hitting $28. The journey includes two gaps up essential for rallying faster, and violating strong resistance like a 200-day moving average. On reaching the level of $28, the bullish rally turned dull, and instead of forming a bullish candle, a doji formed after a gap up. This shows an indecision among traders and a fear of bears coming back. After the doji, the stock saw a huge gap down and closed even lower, completing an evening star pattern. |

|
| FIGURE 1: DELL, DAILY. The evening star is a strong formation, and therefore requires no confirmation. |
| Graphic provided by: StockCharts.com. |
| |
| Even though the evening star is a strong formation it is still a good idea to refer to oscillators and trend indicators for confirmation. While pushing higher, the relative strength index (RSI) (14) failed to cross the 50 level, indicating weaknesses in the rally, and retraced back to 30. The moving average convergence/divergence (MACD) is very negative, supporting the bearish move in the future. In addition, the average directional movement index (ADX) (14) indicates the bearish trend since early November. The increase in bearish pressure might have affected the bullish rally that reached the $30.50 level, tumbling it down to a low of $25.50. See Figure 1. |
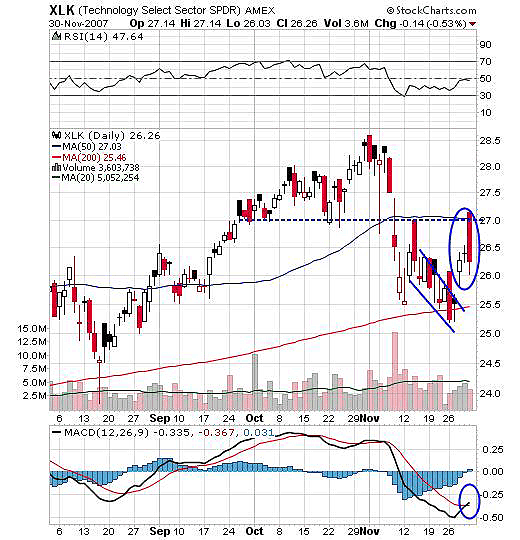
| Dell is not the only technology stock under pressure. The entire technology sector is getting hammered by resistance. The XLK chart clarifies the technology sector momentum and pressures (see Figure 2). The $27 level has been a strong support-resistance area for the previous bullish run and the present pullback rally, respectively. The rally from $28.50 level retraced to the support of the 200-day moving average, losing almost $3. This volatile move established support here and geared up a fresh bullish run. The move started with a gap up on November 28, but not with good volume. In the marked circle in Figure 2, the doji star on November 29 was the trend change warning. And on November 30, bulls tried to violate the resistance level of 27 but failed to sustain and prove the doji star correct. Under pressure, the sector lost a dollar with no bullish strength left. |

|
| FIGURE 2: XLK, DAILY. This chart clarifies the technology sector momentum and pressures. |
| Graphic provided by: StockCharts.com. |
| |
| With the sector index having such a volatile run, individual equities in the sector ought to face hurdles. XLK is standing very close to its 200-MA support, so it may get retested before heading in any particular direction. |
| Dell has lower support of $22.50 and $21, so these levels too can be tested. The stock is likely to see a tough battle between the bulls and bears to carry the trend in one strong direction. The technology sector is under pressure and may have a long wait before seeing a breakout, considering the present volatility in the technology sector globally. |
Active trader in the Indian stock markets since 2003 and a full-time writer. Trading is largely based upon technical analysis.
| Company: | Independent |
| Address: | C1/3 Parth Indraprasth Towers. Vastrapur |
| Ahmedabad, Guj 380015 | |
| E-mail address: | chaitalimohile@yahoo.co.in |
Traders' Resource Links | |
| Independent has not added any product or service information to TRADERS' RESOURCE. | |
Click here for more information about our publications!
Comments
Date: 12/08/07Rank: 3Comment:

Request Information From Our Sponsors
- StockCharts.com, Inc.
- Candle Patterns
- Candlestick Charting Explained
- Intermarket Technical Analysis
- John Murphy on Chart Analysis
- John Murphy's Chart Pattern Recognition
- John Murphy's Market Message
- MurphyExplainsMarketAnalysis-Intermarket Analysis
- MurphyExplainsMarketAnalysis-Visual Analysis
- StockCharts.com
- Technical Analysis of the Financial Markets
- The Visual Investor
- VectorVest, Inc.
- Executive Premier Workshop
- One-Day Options Course
- OptionsPro
- Retirement Income Workshop
- Sure-Fire Trading Systems (VectorVest, Inc.)
- Trading as a Business Workshop
- VectorVest 7 EOD
- VectorVest 7 RealTime/IntraDay
- VectorVest AutoTester
- VectorVest Educational Services
- VectorVest OnLine
- VectorVest Options Analyzer
- VectorVest ProGraphics v6.0
- VectorVest ProTrader 7
- VectorVest RealTime Derby Tool
- VectorVest Simulator
- VectorVest Variator
- VectorVest Watchdog
