HOT TOPICS LIST
- MACD
- Fibonacci
- RSI
- Gann
- ADXR
- Stochastics
- Volume
- Triangles
- Futures
- Cycles
- Volatility
- ZIGZAG
- MESA
- Retracement
- Aroon
INDICATORS LIST
LIST OF TOPICS
PRINT THIS ARTICLE
by Chaitali Mohile
On the face of weak momentum indicators and the trend under pressure, the bulls lose their steam.
Position: N/A
Chaitali Mohile
Active trader in the Indian stock markets since 2003 and a full-time writer. Trading is largely based upon technical analysis.
PRINT THIS ARTICLE
KEEP INDICATOR
EWS Undergoes Weak Pullback Rally
12/06/07 12:00:19 PMby Chaitali Mohile
On the face of weak momentum indicators and the trend under pressure, the bulls lose their steam.
Position: N/A
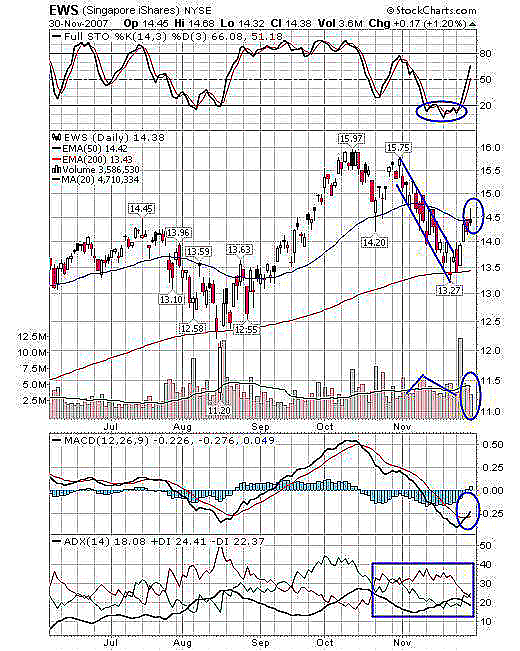
| The Singapore iShare topped out at about 16 levels. The index then corrected toward the lower support of the 200-day exponential moving average (EMA) at 13.5 levels. The falling wedge was formed while the index was correcting with high-volume volatility. The falling wedge is a bullish formation that breaks upside, opening new buying opportunities. Usually, volume reduces as the wedge develops; in Figure 1 below, the volume has remained volatile. |

|
| FIGURE 1: EWS, DAILY. Weak ADX (14), with marginal growth in volume and 50-day EMA resistance, restricted recovery. |
| Graphic provided by: StockCharts.com. |
| |
| The falling wedge breakout occurred in the upside direction, as the stochastic surged from its oversold area offering a new long position, and soon rushed to reach the 50 bullish level. Accordingly, the breakout was supported by the marginal increase in volume, with the positive view of stochastic (14,3,3) and the moving average convergence/divergence (MACD) (12,26,9) turning positive. Though the bullish crossover is yet to confirm, traders might have traded on positive stochastic and anticipating the trend indicator to favor bulls. But the average directional movement index (ADX) (14) failed to show any trend change situation. |
| The ADX (14) since late October indicated high volatility, with positive and negative directional index both moving at an equal pace. The trend indicator had higher selling pressure than buyers, dragging down the price faster. In addition, EWS has yet to cross over the 50-day EMA resistance. So the rally turned weak just as the signal turned positive on the daily chart. |

|
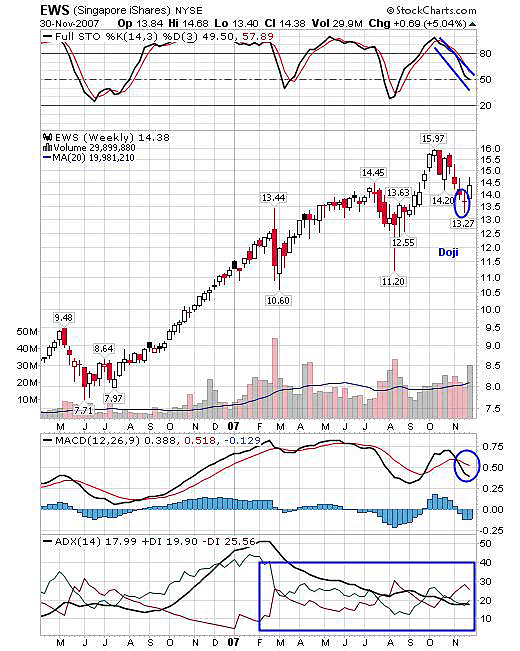
| FIGURE 2: EWS, WEEKLY. Declining stochastic (14,3,3), the MACD (12,26,9) bearish crossover, and again poor ADX (14) were the main hurdles in the pullback rally. |
| Graphic provided by: StockCharts.com. |
| |
| On the weekly chart (Figure 2), the pullback rally began after the doji was formed at the bottom of the corrective rally. The stochastic (14,3,3) has declined from an overbought area around 90-odd levels, and now it stands close to 50. However, the stochastic cannot be considered bullish until it actually takes a U- turn. The MACD (12,26,9) has a bearish crossover in positive territory. And most important, the ADX (14) is 17 with equal bullish and bearish pressure. Currently, if the ADX (14) is observed carefully, -DI is ruling +DI, unable to provide a clear view of a trend change. |
| Thus, on these weak indicators, the recovery in the Singapore iShare will be under threat. At least two indicators should turn positive on both charts to get a healthy pullback rally. |
Active trader in the Indian stock markets since 2003 and a full-time writer. Trading is largely based upon technical analysis.
| Company: | Independent |
| Address: | C1/3 Parth Indraprasth Towers. Vastrapur |
| Ahmedabad, Guj 380015 | |
| E-mail address: | chaitalimohile@yahoo.co.in |
Traders' Resource Links | |
| Independent has not added any product or service information to TRADERS' RESOURCE. | |
Click here for more information about our publications!
Comments
Date: 12/07/07Rank: 5Comment:

Request Information From Our Sponsors
- VectorVest, Inc.
- Executive Premier Workshop
- One-Day Options Course
- OptionsPro
- Retirement Income Workshop
- Sure-Fire Trading Systems (VectorVest, Inc.)
- Trading as a Business Workshop
- VectorVest 7 EOD
- VectorVest 7 RealTime/IntraDay
- VectorVest AutoTester
- VectorVest Educational Services
- VectorVest OnLine
- VectorVest Options Analyzer
- VectorVest ProGraphics v6.0
- VectorVest ProTrader 7
- VectorVest RealTime Derby Tool
- VectorVest Simulator
- VectorVest Variator
- VectorVest Watchdog
- StockCharts.com, Inc.
- Candle Patterns
- Candlestick Charting Explained
- Intermarket Technical Analysis
- John Murphy on Chart Analysis
- John Murphy's Chart Pattern Recognition
- John Murphy's Market Message
- MurphyExplainsMarketAnalysis-Intermarket Analysis
- MurphyExplainsMarketAnalysis-Visual Analysis
- StockCharts.com
- Technical Analysis of the Financial Markets
- The Visual Investor
