HOT TOPICS LIST
- MACD
- Fibonacci
- RSI
- Gann
- ADXR
- Stochastics
- Volume
- Triangles
- Futures
- Cycles
- Volatility
- ZIGZAG
- MESA
- Retracement
- Aroon
INDICATORS LIST
LIST OF TOPICS
PRINT THIS ARTICLE
by Paolo Pezzutti
This one-day pattern indicates that new money has entered the market.
Position: N/A
Paolo Pezzutti
Author of the book "Trading the US Markets - A Comprehensive Guide to US Markets for International Traders and Investors" - Harriman House (July 2008)
PRINT THIS ARTICLE
TECHNICAL ANALYSIS
Wide-Ranging Days And A Map Of The Market
12/05/07 10:14:58 AMby Paolo Pezzutti
This one-day pattern indicates that new money has entered the market.
Position: N/A
| Wide-ranging days are not able to provide clear indications of future price changes, but they help the trader build a picture of the market conditions. Wide-ranging days are one-day patterns that can be defined in different ways. For example, Jack Schwager, in his book Schwager On Futures: Technical Analysis, calls a wide-ranging day one when volatility exceeds the average volatility of the past n days. In particular, the trading day volatility ratio, which is the true range divided by the true range of the past n-day period, has to be greater than k (e.g., k = 2). |
| I define a wide-ranging day as a directional day whose true range is the highest of the past n days, where n can be, say, 20. True range is calculated using true high and true low values. They represent the price as follows: - True high: today's high, or the previous close, whichever is higher - True low: today's low, or the previous close, whichever is lower. The true range is defined as true high-true low. A wide-ranging day is significant. A wide-ranging day occurs when the public enters the market, bringing fresh money. It is an indication of the future market direction. Short-term trading strategies can be based on this pattern. The high-volatility increase indicates that the market sentiment has shifted quickly from one condition to another, with the public emotionally involved in the trading session. Markets alternate between trends and congestions, sometimes losing their balance and moving quickly to a new equilibrium area — that's when these wide-ranging days can be printed hinting at the direction of prices. |

|
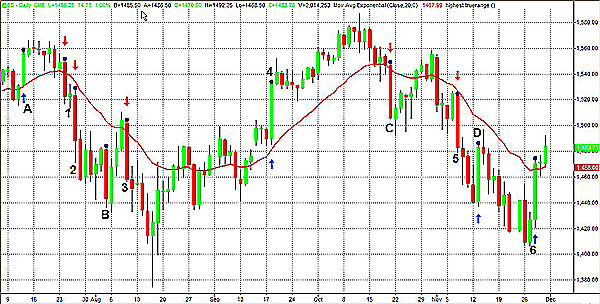
| FIGURE 1: EMINI S&P, DAILY. Expansions of the range in directional trading days generally indicate the direction of the trend. |
| Graphic provided by: TradeStation. |
| |
| In Figure 1, you can see some examples of indications provided by this pattern. The chart displays the emini S&P. Since last July, a number of wide-ranging days have been printed. Six bars were followed by a continuation of prices in the direction of the wide-ranging bar (points from one to six). At point 6, on November 28, the emini has printed an impressive wide-ranging day and the market has had a follow-through of another two days in the same direction so far. On four occasions (points A to D), their indication would have likely led to losses. After the wide-ranging bar, you may have a short-term consolidation, but for this pattern to be successful, you should see prices continue in the direction of the bar after two to five days. |
| I would like to focus, however, on the meaning of the failure of this pattern. Wide-ranging days are characterized by high volume as the public is emotionally involved in the market action. Fresh money enters the market in the prevailing direction of the trading day with a feeling that you must be an active participant now or you may not be able to open your position at the same prices in the following days. |

|
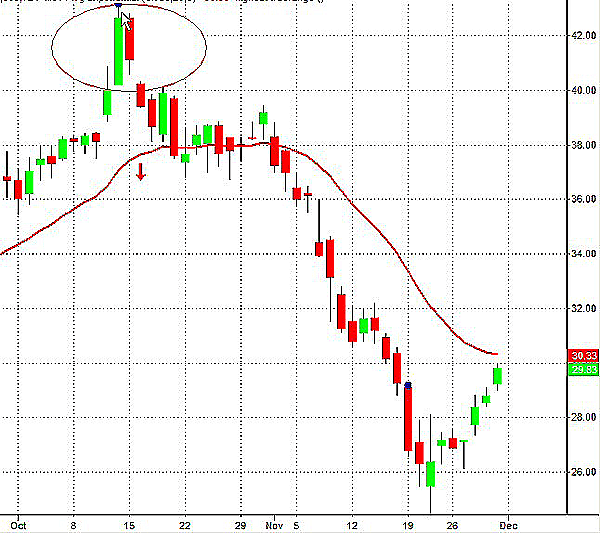
| FIGURE 2: GM, DAILY. The failure of the pattern and the consequent breakout to the downside of the wide-ranging bar low initiated a dramatic move to the downside. |
| Graphic provided by: TradeStation. |
| |
| Of course, in case of an up wide-ranging day, when prices reverse and break out the low of the bar, the public starts to be a loser and you might expect to see traders closing their positions as prices move against them. This can cause an acceleration of prices in the opposite direction of the wide-ranging day and it represents a trading opportunity, especially when it occurs soon after the wide- ranging bar has been printed. As an example, in Figure 2, you can see a dramatic reversal occurred after a failure of this pattern printed on General Motors. |
Author of the book "Trading the US Markets - A Comprehensive Guide to US Markets for International Traders and Investors" - Harriman House (July 2008)
| Address: | VIA ROBERTO AGO 26 POSTAL CODE 00166 |
| Rome, ITALY | |
| Phone # for sales: | +393357540708 |
| E-mail address: | pezzutti.paolo@tiscali.it |
Click here for more information about our publications!
Comments
Date: 12/07/07Rank: 3Comment:

Request Information From Our Sponsors
- StockCharts.com, Inc.
- Candle Patterns
- Candlestick Charting Explained
- Intermarket Technical Analysis
- John Murphy on Chart Analysis
- John Murphy's Chart Pattern Recognition
- John Murphy's Market Message
- MurphyExplainsMarketAnalysis-Intermarket Analysis
- MurphyExplainsMarketAnalysis-Visual Analysis
- StockCharts.com
- Technical Analysis of the Financial Markets
- The Visual Investor
- VectorVest, Inc.
- Executive Premier Workshop
- One-Day Options Course
- OptionsPro
- Retirement Income Workshop
- Sure-Fire Trading Systems (VectorVest, Inc.)
- Trading as a Business Workshop
- VectorVest 7 EOD
- VectorVest 7 RealTime/IntraDay
- VectorVest AutoTester
- VectorVest Educational Services
- VectorVest OnLine
- VectorVest Options Analyzer
- VectorVest ProGraphics v6.0
- VectorVest ProTrader 7
- VectorVest RealTime Derby Tool
- VectorVest Simulator
- VectorVest Variator
- VectorVest Watchdog
