HOT TOPICS LIST
- MACD
- Fibonacci
- RSI
- Gann
- ADXR
- Stochastics
- Volume
- Triangles
- Futures
- Cycles
- Volatility
- ZIGZAG
- MESA
- Retracement
- Aroon
INDICATORS LIST
LIST OF TOPICS
PRINT THIS ARTICLE
by Koos van der Merwe
"The forecaster is like an entrepreneur..."
Position: N/A
Koos van der Merwe
Has been a technical analyst since 1969, and has worked as a futures and options trader with First Financial Futures in Johannesburg, South Africa.
PRINT THIS ARTICLE
GANN
Playing The Forex Game
12/05/07 09:59:44 AMby Koos van der Merwe
"The forecaster is like an entrepreneur..."
Position: N/A
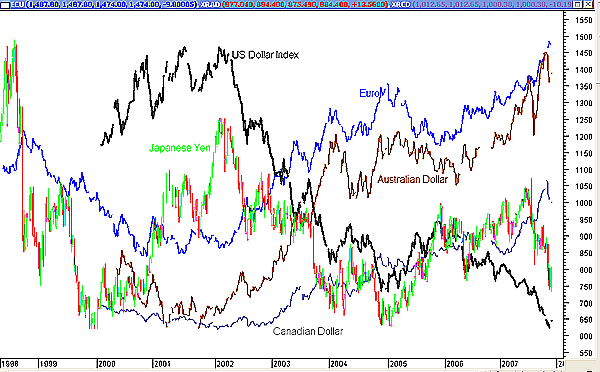
| So said Roman Frydman in the Economist magazine of November 24: "... [H]e studies history and relies on intuition and judgement." Sounds like a technical analyst, doesn't it? But the article in fact is about the abject failure of forecasters to predict the movement of the currencies in the market. Too often have we heard that economists have two hands, and that analysis of fundamentals leads them to opposite conclusions about where prices are going. In particular, the article mentioned the work of two individual writers who examined the persistent failure of economists to predict movements in the currency markets: "It is stunning how hard it is to explain movements in exchange rates." All models show that the euro is overvalued to the US dollar, but does that mean that the US dollar will start rising? I have clients who are currency traders and who ask me to verify certain currency predictions put out by the various banks. I am amazed at how wrong the banks have been in their predictions. There is no doubt in my mind that technical analysis offers a far more accurate forecast. Figure 1 shows my attempt at forecasting the movement of the US dollar. To start with, we must decide which currency to compare the US dollar against. The euro? The Canadian, Australian, or New Zealand dollars? The Japanese yen or the Chinese renmimbi? In this article, I will look at the US dollar against the Canadian dollar. Why? Why not the euro? I will answer that question in the following charts. |

|
| FIGURE 1: CURRENCY COMPLEX. Which currency should be used to compare against the US dollar? |
| Graphic provided by: MetaStock. |
| |
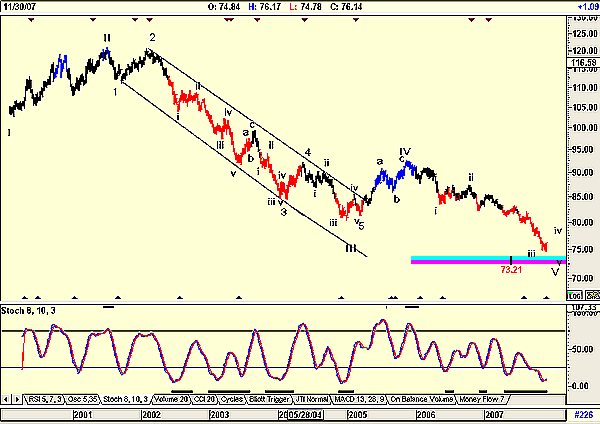
| Figure 1 shows that the euro, Australian dollar, and Canadian dollar all move in opposite directions to the US Dollar Index, so it doesn't quite matter which one we analyze, the final answer will be the same relative to the US dollar. It is simply the strength of the move that will matter. The only oddball is the yen, which seems to be moving in the same direction as the US Dollar Index since 2002. This, I believe, and it could be the subject for another article, is because I believe that the yen is now tied to the Chinese renmimbi, which is fixed to the US dollar. When we look at the US Dollar Index in the chart, we can see how the United States borrowed money from the world in 2001 with a strong US dollar. By borrowing money, I am referring to the paying of imported goods with a strong US dollar that the world invested in US Treasuries, and as we have recently learned with the subprime crises, invested in other, more risky financial instruments. To pay back those loans with a cheap US dollar makes sense, and one of the reasons many countries are considering no longer pegging their currency to the US dollar but rather a basket of currencies. The problem will arise, however, when those countries sell their US dollar debt to buy other debt quoted in the basket flooding the market with even more US dollars. This will weaken the dollar even more — but does it matter? Isn't this what the US Federal Reserve wants? More exports because of a weaker US dollar, and less imports? A country that consumes only its own products? Figure 2 is a weekly chart of the US Dollar Index. I have chosen this index to examine rather than the euro, Australian dollar, Canadian dollar, or any other currency floating against the US dollar because it is representative of the US dollar without emotion or individual country currency manipulation. It is a true index and tells us what the United States is doing to its currency, and why. During the 1980s the prices of oil and gold rose dramatically. In those days we equated 19 barrels of oil to one ounce of gold. Inflation rose and rose and rose to unheard-of heights as the US printed dollars indiscriminately to meet its oil debt. Today, Fed chairman Ben Bernanke is known by his nickname, "Helicopter Ben," because he stated that he would print US dollars indiscriminately to meet the country's debt, and he has been. Yet, inflation has NOT reared its ugly head, and as long as it stays benign, the US mint will print and print and print. How many US dollars are floating around the world today? No one truly knows, even though each banknote has a number on it. Now back to the chart. As you can see, it does look as though the end is nearly in sight, with the US Dollar Index suggesting a target of $73.21, less than a 5% drop from current levels. Note too in the chart that the stochastic oscillator is oversold, and starting to reverse. |

|
| FIGURE 2: US DOLLAR INDEX, WEEKLY. The US Dollar Index may be a better comparison to the dollar because it is representative of the US dollar without emotion, or individual country currency manipulation. |
| Graphic provided by: AdvancedGET. |
| |
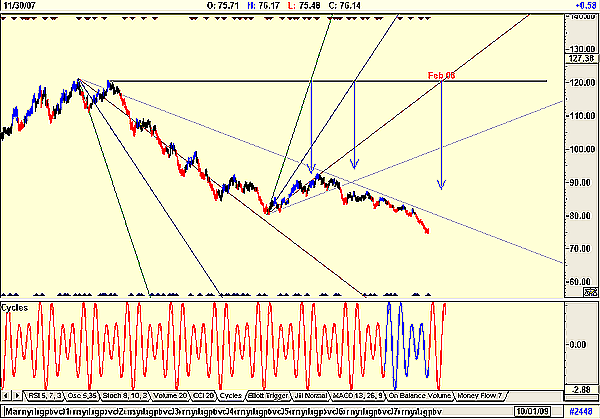
| Now, the question is when. When will the reversal occur? When a new President is elected to the United States, as the country changes direction from its present path, or earlier? For the answer to these questions, I turn to a daily chart (Figure 3). |

|
| FIGURE 3: US DOLLAR INDEX, DAILY, WITH GANN TIMING FANS. These fans are shown from each major turning point. |
| Graphic provided by: AdvancedGET. |
| |
| Figure 3 shows Gann fans from each major turning point. These fans are first created from a major high to a major low with the 1 x 1 intersecting or close to intersecting both points. Being a traditionalist, I prefer using Gann numbers, 0.5, 1, 1.5, 2, 5, and so on. Today's programs will allow you to use intermediate numbers. Once a Gann number has been found it is used to call future fans in changing directions. As you can see from the chart, the turning points are not that accurate, but they do give an indication, more or less, of when we can expect a turning point. In Figure 3, the low of the US Dollar Index could be February 2008. This chart is also showing in the cycle sinewave indicator that we could see intermediate strength, probably over the Christmas season, but for January, it is showing further weakness into February. "Human decisions affecting the future, whether personal, or political or economic, cannot depend on strict mathematical expectation, since the basis for making such calculations does not exist," wrote John Maynard Keynes. On the other hand... |
Has been a technical analyst since 1969, and has worked as a futures and options trader with First Financial Futures in Johannesburg, South Africa.
| Address: | 3256 West 24th Ave |
| Vancouver, BC | |
| Phone # for sales: | 6042634214 |
| E-mail address: | petroosp@gmail.com |
Click here for more information about our publications!
Comments
Date: 12/07/07Rank: 3Comment:

Request Information From Our Sponsors
- VectorVest, Inc.
- Executive Premier Workshop
- One-Day Options Course
- OptionsPro
- Retirement Income Workshop
- Sure-Fire Trading Systems (VectorVest, Inc.)
- Trading as a Business Workshop
- VectorVest 7 EOD
- VectorVest 7 RealTime/IntraDay
- VectorVest AutoTester
- VectorVest Educational Services
- VectorVest OnLine
- VectorVest Options Analyzer
- VectorVest ProGraphics v6.0
- VectorVest ProTrader 7
- VectorVest RealTime Derby Tool
- VectorVest Simulator
- VectorVest Variator
- VectorVest Watchdog
- StockCharts.com, Inc.
- Candle Patterns
- Candlestick Charting Explained
- Intermarket Technical Analysis
- John Murphy on Chart Analysis
- John Murphy's Chart Pattern Recognition
- John Murphy's Market Message
- MurphyExplainsMarketAnalysis-Intermarket Analysis
- MurphyExplainsMarketAnalysis-Visual Analysis
- StockCharts.com
- Technical Analysis of the Financial Markets
- The Visual Investor
