HOT TOPICS LIST
- MACD
- Fibonacci
- RSI
- Gann
- ADXR
- Stochastics
- Volume
- Triangles
- Futures
- Cycles
- Volatility
- ZIGZAG
- MESA
- Retracement
- Aroon
INDICATORS LIST
LIST OF TOPICS
PRINT THIS ARTICLE
by Mike Carr, CMT
Breadth thrusts have long been used by market professionals to spot low-risk buying opportunities.
Position: Buy
Mike Carr, CMT
Mike Carr, CMT, is a member of the Market Technicians Association, and editor of the MTA's newsletter, Technically Speaking. He is also the author of "Smarter Investing in Any Economy: The Definitive Guide to Relative Strength Investing," and "Conquering the Divide: How to Use Economic Indicators to Catch Stock Market Trends."
PRINT THIS ARTICLE
BREADTH THRUST
Market Breadth Screaming "Buy Now!"
12/03/07 10:54:37 AMby Mike Carr, CMT
Breadth thrusts have long been used by market professionals to spot low-risk buying opportunities.
Position: Buy
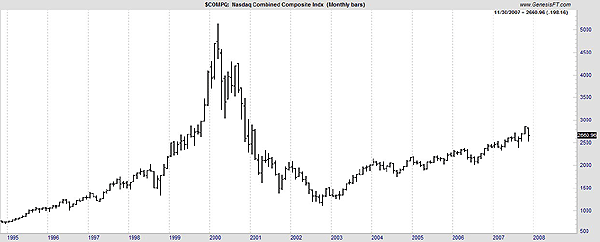
| The health of a market advance can be seen in how broad the participation is. At times, large moves in only a few stocks can drive the market indexes higher. This is what happened in the first few months of 2000. Without the majority of stocks moving higher, the advance was doomed to fail. And fail it did, with the subsequent decline lasting more than two years and knocking almost 80% of the value off the NASDAQ. A long-term chart of the NASDAQ Composite can be seen in Figure 1. |

|
| FIGURE 1: NASDAQ COMPOSITE, MONTHLY. The health of a market advance can be seen in how broad the participation is. At times, large moves in only a few stocks can drive the market indexes higher. |
| Graphic provided by: Trade Navigator. |
| |
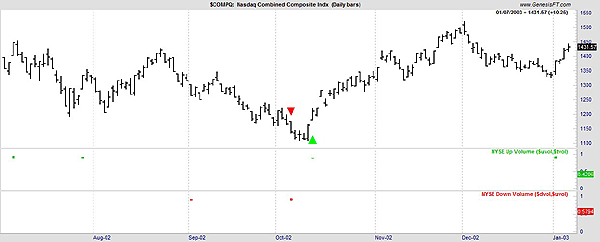
| Ultimately, the bottom of that decline was easy for market pros to spot. In early October (Figure 2), the market showed no sign of bottoming. On October 4, 2002, more than 90% of the day's volume was to the downside. But only five days later, more than 90% of the day's volume was to the upside. This was a signal that the bottom was in, as identified by Paul Desmond of Lowry's Reports in a paper published earlier that year, "Identifying Bear Market Bottoms and New Bull Markets" (https://www.mta.org/eweb/docs/2002DowAwardb.pdf). Desmond quantitatively defined how to spot volume thrusts that signaled a bottom. |

|
| FIGURE 2: NASDAQ COMPOSITE, DAILY. Here's the October 2002 bottom with 90% days highlighted. |
| Graphic provided by: Trade Navigator. |
| |
| The key to spotting the bottom was a series of 90% days. Desmond noted that every major stock market bottom followed a similar pattern — a washout day or series of days where downside volume represented more than 90% of the day's total volume. The volume was in when this washout was followed by a 90% upside within weeks. Complete rules for this signal can be found in his paper. |
| Recently, that work was extended by Rob Hanna of Hanna Capital Management. He found that there have been five times since 1970 when there were two 90% up days in a five-day period. The market was higher one and two months later each time, showing an average gain of 7.5% in one month and 10.6% two months later. In both cases, the worst drawdown was less than 2.5%. |

|
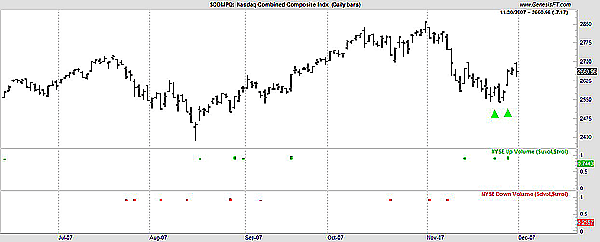
| FIGURE 3: NASDAQ COMPOSITE, DAILY. Recent market action with 90% days are highlighted here. |
| Graphic provided by: Trade Navigator. |
| |
| As shown in Figure 3, there were two 90% up days on November 23 and November 28, 2007. While there is no guarantee that history will repeat, this seems like a low-risk entry point for those seeking short-term gains. Buying QQQQ, SPY, or DIA is an easy way to implement this strategy. |
Mike Carr, CMT, is a member of the Market Technicians Association, and editor of the MTA's newsletter, Technically Speaking. He is also the author of "Smarter Investing in Any Economy: The Definitive Guide to Relative Strength Investing," and "Conquering the Divide: How to Use Economic Indicators to Catch Stock Market Trends."
| Website: | www.moneynews.com/blogs/MichaelCarr/id-73 |
| E-mail address: | marketstrategist@gmail.com |
Click here for more information about our publications!
Comments
Date: 12/04/07Rank: 5Comment: All the best.
Thanks.
Stanley Okun
Date: 12/06/07Rank: 4Comment:

Request Information From Our Sponsors
- StockCharts.com, Inc.
- Candle Patterns
- Candlestick Charting Explained
- Intermarket Technical Analysis
- John Murphy on Chart Analysis
- John Murphy's Chart Pattern Recognition
- John Murphy's Market Message
- MurphyExplainsMarketAnalysis-Intermarket Analysis
- MurphyExplainsMarketAnalysis-Visual Analysis
- StockCharts.com
- Technical Analysis of the Financial Markets
- The Visual Investor
- VectorVest, Inc.
- Executive Premier Workshop
- One-Day Options Course
- OptionsPro
- Retirement Income Workshop
- Sure-Fire Trading Systems (VectorVest, Inc.)
- Trading as a Business Workshop
- VectorVest 7 EOD
- VectorVest 7 RealTime/IntraDay
- VectorVest AutoTester
- VectorVest Educational Services
- VectorVest OnLine
- VectorVest Options Analyzer
- VectorVest ProGraphics v6.0
- VectorVest ProTrader 7
- VectorVest RealTime Derby Tool
- VectorVest Simulator
- VectorVest Variator
- VectorVest Watchdog
