

HOT TOPICS LIST
- MACD
- Fibonacci
- RSI
- Gann
- ADXR
- Stochastics
- Volume
- Triangles
- Futures
- Cycles
- Volatility
- ZIGZAG
- MESA
- Retracement
- Aroon
INDICATORS LIST
LIST OF TOPICS
PRINT THIS ARTICLE
by Chaitali Mohile
The previous high in XLU was at its all-time high. The security is back to its prior high pivot and is now accumulating the strength for a further surge.
Position: Buy
Chaitali Mohile
Active trader in the Indian stock markets since 2003 and a full-time writer. Trading is largely based upon technical analysis.
PRINT THIS ARTICLE
CONSOLID FORMATION
Utilities Select Sector Consolidates At Previous High Resistance
12/05/07 02:19:56 PMby Chaitali Mohile
The previous high in XLU was at its all-time high. The security is back to its prior high pivot and is now accumulating the strength for a further surge.
Position: Buy
| Consolidation is a healthy phase of a rally, where the stock/index accumulates strength before moving further in a particular direction. XLU is consolidating near its previous high resistance for almost a month. The range breakout at the 41.5 level was not encouraging, since there was no increase in volume to support the breakout. In addition, the relative strength index (RSI)(14) was unable to cross 70 levels. The indicator instead continued its range-bound move between 50 and 70. But on the price chart 41.5 was an important resistance level that was turned to support after the breakout. With this breakout, the XLU has approached its previous high level a second time after the large correction. So a breakthrough is very important and also requires support by the entire financial market. |
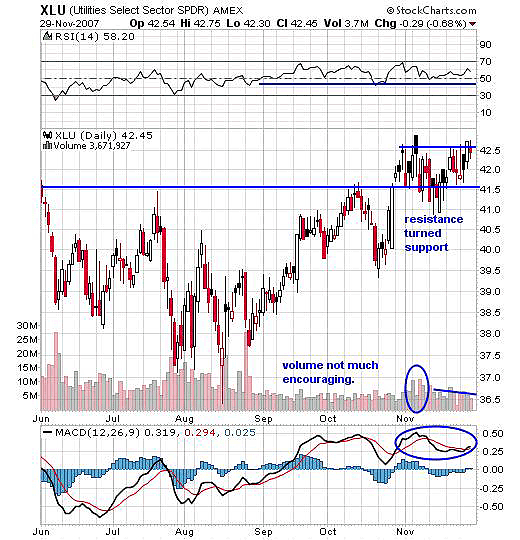
|
| FIGURE 1: XLU, DAILY. XLU formed a rectangle with support at the 41.5 level and the resistance of a previous high at the 43 level. The breakout above this rectangle will see a bullish rally. |
| Graphic provided by: StockCharts.com. |
| |
| With the present volatility in the global market, holding these levels is highly important. So for XLU the support line of 41.5 would be important and consolidating higher would bring a more bullish view with positive RSI (14). The moving average convergence/divergence (MACD) (12,26,9) is in positive territory with a bullish crossover underway. But we need to wait for a confirmed crossover. The indicator shows volatility in this territory. Figure 1 has more of a bullish signal for a breakout so consolidation here is healthy as well. The breakout above the rectangle would give birth to a fresh bullish rally. |
|
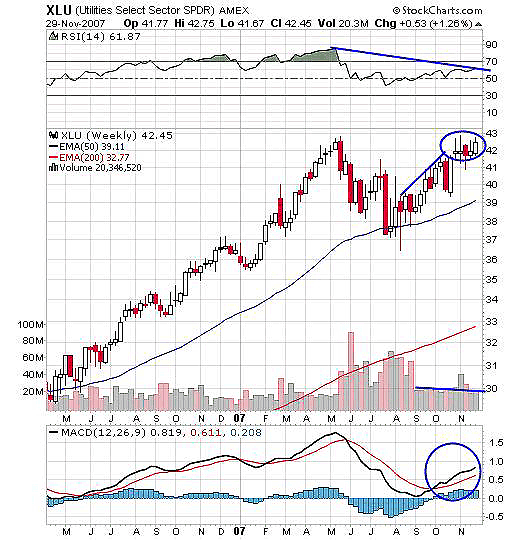
| FIGURE 2: XLU, WEEKLY. The RSI (14) formed a lower high in the bullish area. The flag & pennant breakout will give birth to a new upside move. |
| Graphic provided by: StockCharts.com. |
| |
| The consolidation resulted in the the flag & pennant formation in Figure 2. There was a plunge after hitting the high of 43 in mid-May 2007. The recovery thereafter is back to this resistance level. The RSI (14) is the highlight in Figure 2, as it has divergence on this rally. The indicator is bullish on the present rally but has formed a lower high than the earlier rally. The other indicator, MACD (12,26,9), is very much positive and would be supportive if the breakout happens in a trading session sometime soon. But I repeat, for a breakout to happen and sustain, the support from the entire market is also essential. |
| For enthusiastic traders, I would like to mention the target also. The estimated price level is measured by adding the length of advance rally (the flagpole) to the breakout level (43 here). So the length of the flagpole is 42 - 37 = 5, and therefore by adding 5 to 43, our target would be 48. But traders are requested to wait to confirm a breakout of price and the RSI (14) as well. The volumes also should rise with the breakout, as it is one of the important conditions for the breakout to sustain. |
Active trader in the Indian stock markets since 2003 and a full-time writer. Trading is largely based upon technical analysis.
| Company: | Independent |
| Address: | C1/3 Parth Indraprasth Towers. Vastrapur |
| Ahmedabad, Guj 380015 | |
| E-mail address: | chaitalimohile@yahoo.co.in |
Traders' Resource Links | |
| Independent has not added any product or service information to TRADERS' RESOURCE. | |
Click here for more information about our publications!
Comments
Date:�12/07/07Rank:�5Comment:�This guy s commentaries r always on the money, besides being simple.
Karmel

Request Information From Our Sponsors
- StockCharts.com, Inc.
- Candle Patterns
- Candlestick Charting Explained
- Intermarket Technical Analysis
- John Murphy on Chart Analysis
- John Murphy's Chart Pattern Recognition
- John Murphy's Market Message
- MurphyExplainsMarketAnalysis-Intermarket Analysis
- MurphyExplainsMarketAnalysis-Visual Analysis
- StockCharts.com
- Technical Analysis of the Financial Markets
- The Visual Investor
- VectorVest, Inc.
- Executive Premier Workshop
- One-Day Options Course
- OptionsPro
- Retirement Income Workshop
- Sure-Fire Trading Systems (VectorVest, Inc.)
- Trading as a Business Workshop
- VectorVest 7 EOD
- VectorVest 7 RealTime/IntraDay
- VectorVest AutoTester
- VectorVest Educational Services
- VectorVest OnLine
- VectorVest Options Analyzer
- VectorVest ProGraphics v6.0
- VectorVest ProTrader 7
- VectorVest RealTime Derby Tool
- VectorVest Simulator
- VectorVest Variator
- VectorVest Watchdog