HOT TOPICS LIST
- MACD
- Fibonacci
- RSI
- Gann
- ADXR
- Stochastics
- Volume
- Triangles
- Futures
- Cycles
- Volatility
- ZIGZAG
- MESA
- Retracement
- Aroon
INDICATORS LIST
LIST OF TOPICS
PRINT THIS ARTICLE
by Chaitali Mohile
The upside breakout failed due to previous range resistance, though the surge was supported by good volume.
Position: N/A
Chaitali Mohile
Active trader in the Indian stock markets since 2003 and a full-time writer. Trading is largely based upon technical analysis.
PRINT THIS ARTICLE
BREAKOUTS
Breakout Fails In Analog Devices, Inc.
12/03/07 12:05:59 PMby Chaitali Mohile
The upside breakout failed due to previous range resistance, though the surge was supported by good volume.
Position: N/A
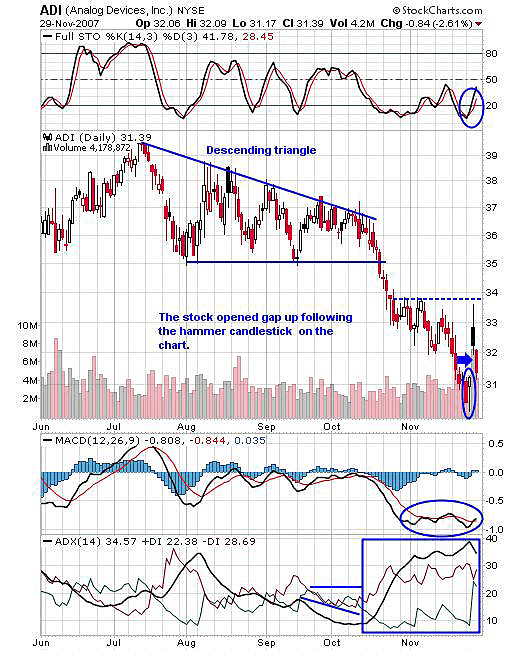
| The longer it takes for a pattern to form the more significant the breakout is. Analog Devices, Inc. (ADI), moved in a series of lower highs after hitting its high levels at 39. The narrow range further formed a descending triangle with a buy line at 35. The triangle is a bearish formation with a breakout in a downward direction. In Figure 1, the triangle broke down below its buy line and within a month and a half hit its target of 31. The target here is calculated by measuring the length of a triangle and subtracting it from a breakout level. The length of a descending triangle is 39 - 35 = 4, and therefore, 35 - 4 = 31 is the target for the breakdown. As you can see on the chart the hammer formed exactly as the the stock price reached the target. |
| The hammer is the bullish candlestick pattern that is formed during the downtrend. The candlestick indicates that the downtrend is getting hammered and is likely to begin a bullish rally. The gap up opening on November 28 reconfirmed the bullish candlestick formation. In addition, the gap up was a breakout that happened on a healthy rise in volume along with a positive surge of stochastic (14,3,3). However, the other two indicators were not favoring this bullish move, so this may have been one of the reasons for the breakout failure. Another would be while the stock was rallying toward its downside target, price moved marginally in a sideways action in the range of 34-33, making the area sensitive to a support-resistance for a future rally. |

|
| FIGURE 1: ADI, DAILY. The gap up breakout failed as the next day, ADI opened below the resistance level and filled the earlier gap. |
| Graphic provided by: StockCharts.com. |
| |
| So even though a gap-up breakout occurred, the range obstructed the rally and the stock was dragged down, filling up the gap. The average directional movement index (ADX)(14) at 34 shows a well-developed downtrend, though it has declined from the 40 level. Currently, the trend indicator is bearish with selling pressure. The moving average convergence/divergence (MACD) (12,26,9) is undergoing volatile moves in negative territory. |
| I think the possibility for an upside rally is slim. The support at 30 would make the stock consolidate at a lower level, and if the support gets violated, then you can expect a bearish rally. So it is probably best not to enter a long trade in anticipation of a bullish move, but watch the support area. |
Active trader in the Indian stock markets since 2003 and a full-time writer. Trading is largely based upon technical analysis.
| Company: | Independent |
| Address: | C1/3 Parth Indraprasth Towers. Vastrapur |
| Ahmedabad, Guj 380015 | |
| E-mail address: | chaitalimohile@yahoo.co.in |
Traders' Resource Links | |
| Independent has not added any product or service information to TRADERS' RESOURCE. | |
Click here for more information about our publications!
Comments
Date: 12/06/07Rank: 5Comment:

Request Information From Our Sponsors
- StockCharts.com, Inc.
- Candle Patterns
- Candlestick Charting Explained
- Intermarket Technical Analysis
- John Murphy on Chart Analysis
- John Murphy's Chart Pattern Recognition
- John Murphy's Market Message
- MurphyExplainsMarketAnalysis-Intermarket Analysis
- MurphyExplainsMarketAnalysis-Visual Analysis
- StockCharts.com
- Technical Analysis of the Financial Markets
- The Visual Investor
- VectorVest, Inc.
- Executive Premier Workshop
- One-Day Options Course
- OptionsPro
- Retirement Income Workshop
- Sure-Fire Trading Systems (VectorVest, Inc.)
- Trading as a Business Workshop
- VectorVest 7 EOD
- VectorVest 7 RealTime/IntraDay
- VectorVest AutoTester
- VectorVest Educational Services
- VectorVest OnLine
- VectorVest Options Analyzer
- VectorVest ProGraphics v6.0
- VectorVest ProTrader 7
- VectorVest RealTime Derby Tool
- VectorVest Simulator
- VectorVest Variator
- VectorVest Watchdog
