HOT TOPICS LIST
- MACD
- Fibonacci
- RSI
- Gann
- ADXR
- Stochastics
- Volume
- Triangles
- Futures
- Cycles
- Volatility
- ZIGZAG
- MESA
- Retracement
- Aroon
INDICATORS LIST
LIST OF TOPICS
PRINT THIS ARTICLE
by Chaitali Mohile
With November closing out, Apple is likely to form a hanging man pattern with a declining relative strength index from the overbought area.
Position: N/A
Chaitali Mohile
Active trader in the Indian stock markets since 2003 and a full-time writer. Trading is largely based upon technical analysis.
PRINT THIS ARTICLE
CHART ANALYSIS
Uptrend Ends For Apple, Inc.?
11/30/07 11:47:54 AMby Chaitali Mohile
With November closing out, Apple is likely to form a hanging man pattern with a declining relative strength index from the overbought area.
Position: N/A
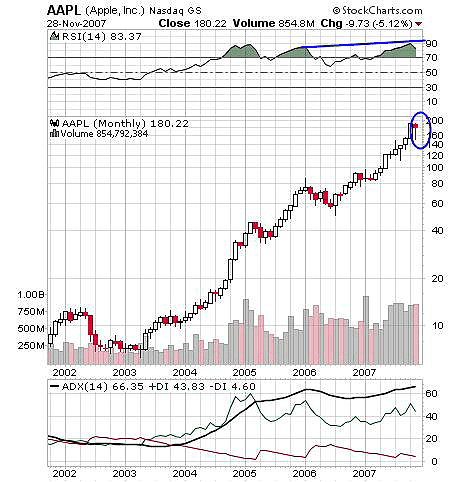
| Apple, Inc. designs and manufactures personal computers, consumer electronics and closely related software products. With strong fundamental and good technical support, the stock had a solid bull run for more than four years, climbing higher and higher, marking its all-time high at $192. November has been its only bearish month in 2007. In previous months the upside move was well supported by the bullish strength of the relative strength index (RSI) (14) and strong uptrend. In the monthly chart (see Figure 1), the stock hit its all-time high at $192, with RSI (14) close to 90 levels. The average directional movement index (ADX) (14) has entered the overheated area of 60-plus. All three combinations in Figure 1 indicate the extremes of the bull ride, which ends the one-sided move sometimes. This is why confirmation is essential. |

|
| FIGURE 1: AAPL, MONTHLY. The overbought RSI (14) has begun its downside journey, adding bearish strength to the hanging man. In addition, ADX (14) is highly overheated, so the indicator is also likely to decline. |
| Graphic provided by: StockCharts.com. |
| |
| These high notes of a bullish ride are accompanied by a bearish view. Traders must have already smelled the bears. In Figure 2 you can see that in November the stock opened at an all-time high, rallied to a low around $150, and traded near the high of the month. The trading near its high means there was a recovery after the correction of approximately 40 points. But this trading pattern formed a hanging man at the top levels. The hanging man is a bearish pattern, and the color of the body of the pattern adds more significance. The red hanging man is a bearish pattern, indicating an end to an uptrend and initiating a new downtrend. Declining RSI (14) from the overbought area and highly overheated ADX (14) adds up the bearish strength. |
| From Figure 1, the monthly chart, I would say that if you want to short the stock you should do it for shorter periods and be watchful of the indicators. Though the hanging man is a bearish pattern, the change in trend can be temporary. Keeping an eye on the RSI (14) is a good idea since it can suggest a change in trend. |

|
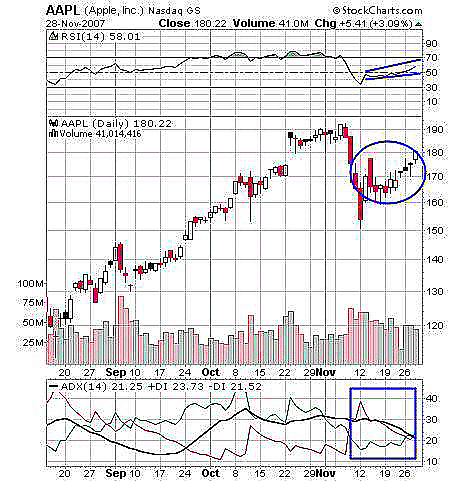
| FIGURE 2: AAPL, DAILY. The bullish strength of RSI (14) is supporting the surge toward the previous high opening trading opportunities. |
| Graphic provided by: StockCharts.com. |
| |
| The RSI (14) rallied in the overbought area for almost all of October as price was traveling toward its all-time high of $192. Later, the RSI (14) dropped steeply below the 50 level in just four days. The price corrected as well, making a low of $150, losing almost 40 points. The recovery thereafter was highly volatile, reflected by smaller candles and few doji. The volume remained volatile too; however, the RSI (14) indicated bullish strength. The correction has increased the seller's pressure temporarily on the average directional movement index (ADX) (14). Now with price recovery, +DI and -DI are very close, indicating some volatility while traveling upward. The stock is likely to hit its previous high with the bullish strength of RSI (14), so a high-risk long trade is possible with the target of a previous high. |
| Traders need not get confused with two opposite trading recommendations. The monthly chart in Figure 1 suggests a correction whereas the daily chart (Figure 2), shows price approaching its previous high. A bullish RSI (14) suggests a long position for a smaller period, say a day or two. |
Active trader in the Indian stock markets since 2003 and a full-time writer. Trading is largely based upon technical analysis.
| Company: | Independent |
| Address: | C1/3 Parth Indraprasth Towers. Vastrapur |
| Ahmedabad, Guj 380015 | |
| E-mail address: | chaitalimohile@yahoo.co.in |
Traders' Resource Links | |
| Independent has not added any product or service information to TRADERS' RESOURCE. | |
Click here for more information about our publications!
Comments
Date: 12/02/07Rank: 5Comment: I appreciate the understanding which you people gave to me.
Thanks.
Stanley Okun.
Date: 12/06/07Rank: 4Comment:

Request Information From Our Sponsors
- StockCharts.com, Inc.
- Candle Patterns
- Candlestick Charting Explained
- Intermarket Technical Analysis
- John Murphy on Chart Analysis
- John Murphy's Chart Pattern Recognition
- John Murphy's Market Message
- MurphyExplainsMarketAnalysis-Intermarket Analysis
- MurphyExplainsMarketAnalysis-Visual Analysis
- StockCharts.com
- Technical Analysis of the Financial Markets
- The Visual Investor
- VectorVest, Inc.
- Executive Premier Workshop
- One-Day Options Course
- OptionsPro
- Retirement Income Workshop
- Sure-Fire Trading Systems (VectorVest, Inc.)
- Trading as a Business Workshop
- VectorVest 7 EOD
- VectorVest 7 RealTime/IntraDay
- VectorVest AutoTester
- VectorVest Educational Services
- VectorVest OnLine
- VectorVest Options Analyzer
- VectorVest ProGraphics v6.0
- VectorVest ProTrader 7
- VectorVest RealTime Derby Tool
- VectorVest Simulator
- VectorVest Variator
- VectorVest Watchdog
