HOT TOPICS LIST
- MACD
- Fibonacci
- RSI
- Gann
- ADXR
- Stochastics
- Volume
- Triangles
- Futures
- Cycles
- Volatility
- ZIGZAG
- MESA
- Retracement
- Aroon
INDICATORS LIST
LIST OF TOPICS
PRINT THIS ARTICLE
by Gary Grosschadl
Is a two-year bottom in for this volatile stock, the original 100% commercial-free music satellite radio service?
Position: Buy
Gary Grosschadl
Independent Canadian equities trader and technical analyst based in Peterborough
Ontario, Canada.
PRINT THIS ARTICLE
MOVING AVERAGES
Serious About Sirius
11/29/07 11:33:57 AMby Gary Grosschadl
Is a two-year bottom in for this volatile stock, the original 100% commercial-free music satellite radio service?
Position: Buy
| Sirius (SIRI) rocketed up to near $70 early in 2000 and then declined even quicker to below the $1 mark by 2003. It zoomed up again in 2004, taking the stock from $2 to $9 in a mere four months. From late 2005 the stock endured a slow but steady decline to below $3 earlier this year. |
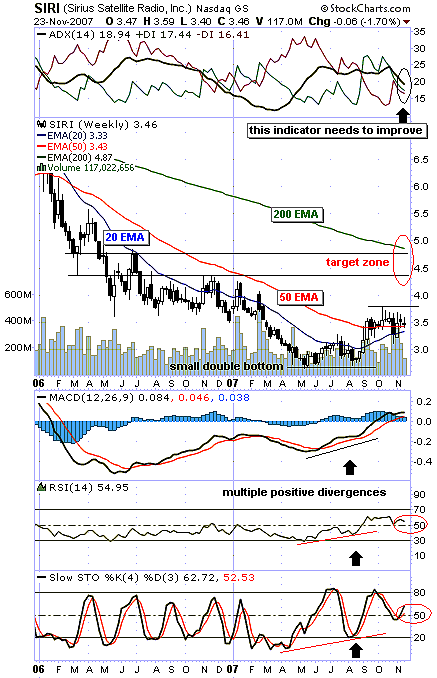
| Now, for the first time in nearly two years, the stock has managed several closes above its 50-period exponential moving average (EMA) (currently 3.43). Stocks dragging the bottom often find themselves under the weight of their 20-day and 50-day EMAs. Both have been recently breached as the stock makes a serious effort at a bottom bounce. (See Figure 1.) |

|
| FIGURE 1: SIRI, WEEKLY. Will this long-suffering stock challenge its 200-period exponential moving average or fall short? |
| Graphic provided by: StockCharts.com. |
| |
| The upside trader's targets are deemed to be within a range of $4.40–$5. This encompasses previous levels of support and resistance at $4.40 and $4.80, as well as the the ever-important 200-period moving average currently near $5 ($4.87). These levels will likely be marked by aggressive short-term traders wanting to take timely profits should their luck prevail. |
| Several indicators are commented on. The directional movement indicator shows a declining average directional movement index (ADX) line with a marginally bullish DIs (directional indicators). For this indicator to swing bullishly, we need to see the positive directional indicator (in green) to rise above the ADX line and that same ADX line (in black) needs to reverse course sloping upward. Good trend strength is usually indicated when this ADX line rises above 20. The lower indicators all show a previous positive divergence to price action, foretelling the recent rise above the second bottom. Now the MACD (moving average convergence/divergence) shows continuing strength above its zero-line, as does the RSI (relative strength index) with its continuation above the often-key 50 level. The stochastic oscillator shows a "high" bullish turn above its 50 level, hinting at a bullish resumption. |
| For bullish fruition, the stock needs to stay above its 50-level EMA and close above the recent high of $3.80 to give it a chance of hitting the target zone. A close below the rising 20-period EMA would negate this bullish posture. |
Independent Canadian equities trader and technical analyst based in Peterborough
Ontario, Canada.
| Website: | www.whatsonsale.ca/financial.html |
| E-mail address: | gwg7@sympatico.ca |
Click here for more information about our publications!
Comments
Date: 12/06/07Rank: 2Comment:

Request Information From Our Sponsors
- StockCharts.com, Inc.
- Candle Patterns
- Candlestick Charting Explained
- Intermarket Technical Analysis
- John Murphy on Chart Analysis
- John Murphy's Chart Pattern Recognition
- John Murphy's Market Message
- MurphyExplainsMarketAnalysis-Intermarket Analysis
- MurphyExplainsMarketAnalysis-Visual Analysis
- StockCharts.com
- Technical Analysis of the Financial Markets
- The Visual Investor
- VectorVest, Inc.
- Executive Premier Workshop
- One-Day Options Course
- OptionsPro
- Retirement Income Workshop
- Sure-Fire Trading Systems (VectorVest, Inc.)
- Trading as a Business Workshop
- VectorVest 7 EOD
- VectorVest 7 RealTime/IntraDay
- VectorVest AutoTester
- VectorVest Educational Services
- VectorVest OnLine
- VectorVest Options Analyzer
- VectorVest ProGraphics v6.0
- VectorVest ProTrader 7
- VectorVest RealTime Derby Tool
- VectorVest Simulator
- VectorVest Variator
- VectorVest Watchdog
