HOT TOPICS LIST
- MACD
- Fibonacci
- RSI
- Gann
- ADXR
- Stochastics
- Volume
- Triangles
- Futures
- Cycles
- Volatility
- ZIGZAG
- MESA
- Retracement
- Aroon
INDICATORS LIST
LIST OF TOPICS
PRINT THIS ARTICLE
by Gary Grosschadl
The world's largest supplier of flash memory data storage products looks like a low-risk buy.
Position: Buy
Gary Grosschadl
Independent Canadian equities trader and technical analyst based in Peterborough
Ontario, Canada.
PRINT THIS ARTICLE
CHART ANALYSIS
Low-Risk Entry For Sandisk Corp.?
11/28/07 08:20:37 AMby Gary Grosschadl
The world's largest supplier of flash memory data storage products looks like a low-risk buy.
Position: Buy
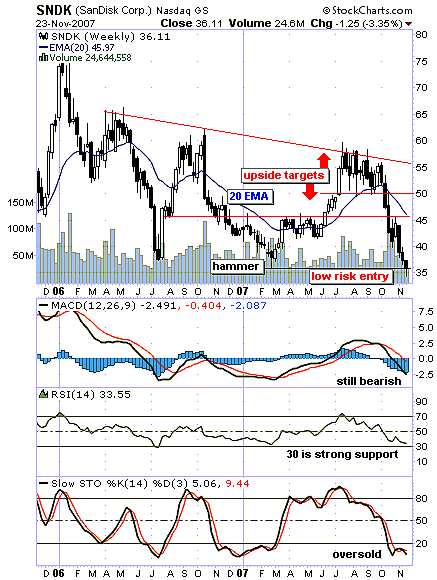
| Figure 1, a weekly chart, shows the stock price hitting a two-year low, closing at the low of last February's bottom hammer candlestick. The current candlestick is close to a hammer but the tail or lower shadow is a bit short for the classic hammer signal, which ideally has the tail at least twice as long as the real body. Either way, I like the low-risk entry point here. |
| The indicators displayed do reflect a very early entry point consideration. The moving average convergence/divergence (MACD) still needs to turn up, but this indicator does tend to lag. The relative strength index (RSI) hints at support very near the often telling 30 level. The stochastic oscillator is in an oversold condition and needs to break above its 20 level before it turns bullish. |

|
| FIGURE 1: SNDK, WEEKLY. A low-risk entry can be considered on this chart of the electronics technology company. |
| Graphic provided by: StockCharts.com. |
| |
| Should this indeed turn out to be a bottom for this stock, several upside targets are anticipated. The overhead 20-period exponential moving average (EMA), currently $46, matches a previous support/resistance level, making this the first upside target. Should this level be broken, the next target is $50, another previous level of support. The most ambitious target is the trendline near $55. |
| Whether the stock does turn here remains to be seen. The question is whether this is merely a bear rally to the 20-day EMA. The lure of this early entry is to capture a handsome gain, even if it turns out to be a failure move to overhead resistance. |
Independent Canadian equities trader and technical analyst based in Peterborough
Ontario, Canada.
| Website: | www.whatsonsale.ca/financial.html |
| E-mail address: | gwg7@sympatico.ca |
Click here for more information about our publications!
Comments
Date: 11/28/07Rank: 4Comment:

Request Information From Our Sponsors
- StockCharts.com, Inc.
- Candle Patterns
- Candlestick Charting Explained
- Intermarket Technical Analysis
- John Murphy on Chart Analysis
- John Murphy's Chart Pattern Recognition
- John Murphy's Market Message
- MurphyExplainsMarketAnalysis-Intermarket Analysis
- MurphyExplainsMarketAnalysis-Visual Analysis
- StockCharts.com
- Technical Analysis of the Financial Markets
- The Visual Investor
- VectorVest, Inc.
- Executive Premier Workshop
- One-Day Options Course
- OptionsPro
- Retirement Income Workshop
- Sure-Fire Trading Systems (VectorVest, Inc.)
- Trading as a Business Workshop
- VectorVest 7 EOD
- VectorVest 7 RealTime/IntraDay
- VectorVest AutoTester
- VectorVest Educational Services
- VectorVest OnLine
- VectorVest Options Analyzer
- VectorVest ProGraphics v6.0
- VectorVest ProTrader 7
- VectorVest RealTime Derby Tool
- VectorVest Simulator
- VectorVest Variator
- VectorVest Watchdog
