HOT TOPICS LIST
- MACD
- Fibonacci
- RSI
- Gann
- ADXR
- Stochastics
- Volume
- Triangles
- Futures
- Cycles
- Volatility
- ZIGZAG
- MESA
- Retracement
- Aroon
INDICATORS LIST
LIST OF TOPICS
PRINT THIS ARTICLE
by Gary Grosschadl
Here's an example of a gapping play, with the danger and the opportunity.
Position: Buy
Gary Grosschadl
Independent Canadian equities trader and technical analyst based in Peterborough
Ontario, Canada.
PRINT THIS ARTICLE
GAPS
Biogen's Gift Horse Gap Closes
11/26/07 01:55:23 PMby Gary Grosschadl
Here's an example of a gapping play, with the danger and the opportunity.
Position: Buy
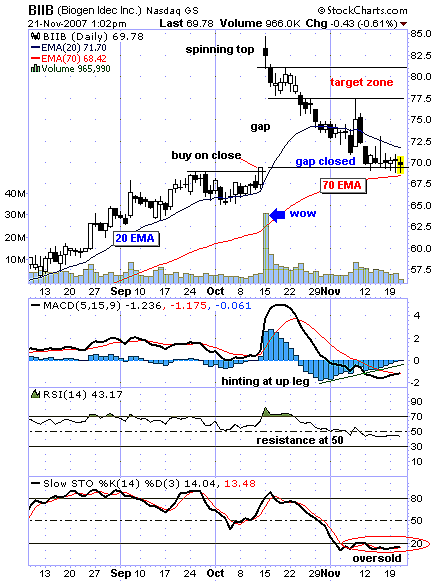
| Figure 1, a daily chart of Biogen Idec, Inc. (a biotechnology company specializing in drugs for neurological disorders, autoimmune disorders, and cancer), is a great example of what often happens on a large gap up. In this case the stock hit its 52-week high of $84.75 in early October after soaring on buyout rumors; note the spinning top candlestick hinting that this was a potential top. The axiom "buy the rumor, sell the news" obviously would have failed in this case. |
| Patient traders often keep their powder dry and wait for gaps to close as a much wiser and safer entry. This is the opportunity now for the intrepid short-term trader or the fortunate longer-term trader who may have taken the gift horse at face value, cashed in and wants back on this bucking bronco. The gap is closed, buying on support. |

|
| FIGURE 1: BIOGEN, DAILY. The large/dangerous gap now is closed, affording a safer entry. |
| Graphic provided by: StockCharts.com. |
| |
| Note there was an opportunity for a momentum-type trader who sees a buy. This would have been a safe entry for a possible breakout play. The stock closed on a new high after finding support from the nearby 20-day exponential moving average (EMA). It does not get much safer than that for a potential breakout play; the trick is you have to be watching this stock closely to buy before the closing bell or have a buy-stop order in place. The order is triggered when the market price touches or goes through the buy-stop price. If the price exceeds the price you have set, it will automatically trigger a market order. |
| The indicators below the chart are considered, with the most hopeful being the MACD (moving average convergence/divergence). Here we see a bullish cross of the signal line just beginning and its histogram showing a positive divergence to recent price action. The relative strength index (RSI) languishes below its key 50-level warning of overhead resistance. The stochastic oscillator shows an oversold condition and needs to turn up through the 20 level to reflect a potential up-leg beginning. |
| An aggressive short-term play is suggested with a target zone between $77.50 and $81. Action at the nearby moving averages need to be monitored, as the next move will likely be a bearish close under the 70-day EMA (negating a buy) or a bullish close above the 20-day EMA, currently 71.70. |
Independent Canadian equities trader and technical analyst based in Peterborough
Ontario, Canada.
| Website: | www.whatsonsale.ca/financial.html |
| E-mail address: | gwg7@sympatico.ca |
Click here for more information about our publications!
Comments
Date: 11/27/07Rank: 5Comment:

Request Information From Our Sponsors
- VectorVest, Inc.
- Executive Premier Workshop
- One-Day Options Course
- OptionsPro
- Retirement Income Workshop
- Sure-Fire Trading Systems (VectorVest, Inc.)
- Trading as a Business Workshop
- VectorVest 7 EOD
- VectorVest 7 RealTime/IntraDay
- VectorVest AutoTester
- VectorVest Educational Services
- VectorVest OnLine
- VectorVest Options Analyzer
- VectorVest ProGraphics v6.0
- VectorVest ProTrader 7
- VectorVest RealTime Derby Tool
- VectorVest Simulator
- VectorVest Variator
- VectorVest Watchdog
- StockCharts.com, Inc.
- Candle Patterns
- Candlestick Charting Explained
- Intermarket Technical Analysis
- John Murphy on Chart Analysis
- John Murphy's Chart Pattern Recognition
- John Murphy's Market Message
- MurphyExplainsMarketAnalysis-Intermarket Analysis
- MurphyExplainsMarketAnalysis-Visual Analysis
- StockCharts.com
- Technical Analysis of the Financial Markets
- The Visual Investor
