HOT TOPICS LIST
- MACD
- Fibonacci
- RSI
- Gann
- ADXR
- Stochastics
- Volume
- Triangles
- Futures
- Cycles
- Volatility
- ZIGZAG
- MESA
- Retracement
- Aroon
INDICATORS LIST
LIST OF TOPICS
PRINT THIS ARTICLE
by Gary Grosschadl
Stiff overhead resistance for the high-tech composite index looks likely.
Position: Sell
Gary Grosschadl
Independent Canadian equities trader and technical analyst based in Peterborough
Ontario, Canada.
PRINT THIS ARTICLE
ANDREWS PITCH-FORK
Tough Days Ahead For The NASDAQ
11/21/07 09:03:09 AMby Gary Grosschadl
Stiff overhead resistance for the high-tech composite index looks likely.
Position: Sell
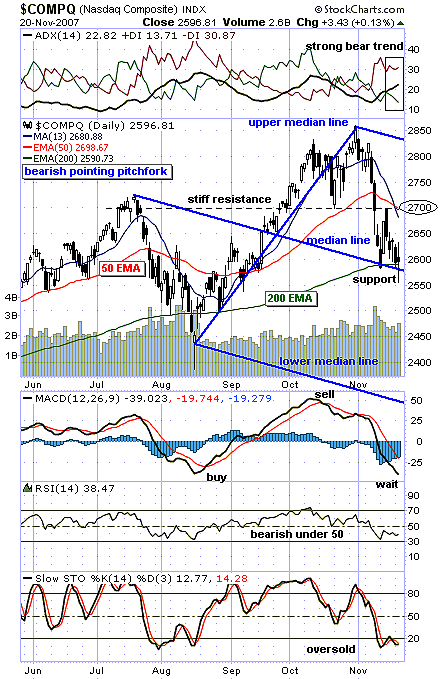
| After a strong up leg from 2400 to 2850 (in only three months), a bearish trend is now evident. Figure 1 shows several bearish markers emphasized with a bearish pointing pitchfork (also known as the Andrews line method). To plot the pitchfork, we only need to choose three turning points, and the charting software paints the pitchfork view. These points are the initial high near 2700, the low below 2450, and the subsequent high at 2850. Pitchfork traders would have been right on the money sticking to the downside target of the median line support. |
| Pitchfork theory holds that this bearish trend is in place until resistance at the upper median line has been overcome. Likely action may be a down slide skipping off the center median line. If a super bear emerges, then a move toward the lower median line may result. Note how the ever-important 200-day exponential moving average (EMA) coincides with current median line support hinting at the validity of this pitchfork chart. |

|
| FIGURE 1: NASDAQ COMPOSITE, DAILY. The NASDAQ composite appears to be sliding down a pitchfork. |
| Graphic provided by: StockCharts.com. |
| |
| Several other indicators above and below the chart also reflect a bearish tone. The directional movement indicator above the chart shows a strong bear trend with the average directional movement index (ADX) line uptrending above the 20 level, while the DIs (directional indicators) are bearishly poised. Below the chart we have the moving average convergence/divergence (MACD) still downsloping. At times this indicator gives very clear buy and sell signs. A "wait" signal can now be assumed until the classic crossover from low levels transpires. The relative strength index (RSI) shows bearishness under 50 but also shows good support from its 30 level. Meanwhile, the stochastic oscillator reflects an oversold condition waiting for an upswing. |
| Should median line support hold, a bear rally is mused to fail at stiff overhead resistance at or near 2700. This area represents previous support and resistance levels as well as a convergence of overhead moving averages, in this case the 13-day MA and the 50-day EMA. This index may now be in failure mode, with bear rallies dying at the downsloping 50-day EMA line. |
| In summary, the trend is down with fluctuations likely between median line support (center) and overhead 50-day EMA. Larger moves would involve swings to either the upper or lower median lines. Everything I need to know I learned in kindergarten and the family farm, one might muse. |
Independent Canadian equities trader and technical analyst based in Peterborough
Ontario, Canada.
| Website: | www.whatsonsale.ca/financial.html |
| E-mail address: | gwg7@sympatico.ca |
Click here for more information about our publications!
Comments
Date: 11/25/07Rank: 3Comment:

Request Information From Our Sponsors
- StockCharts.com, Inc.
- Candle Patterns
- Candlestick Charting Explained
- Intermarket Technical Analysis
- John Murphy on Chart Analysis
- John Murphy's Chart Pattern Recognition
- John Murphy's Market Message
- MurphyExplainsMarketAnalysis-Intermarket Analysis
- MurphyExplainsMarketAnalysis-Visual Analysis
- StockCharts.com
- Technical Analysis of the Financial Markets
- The Visual Investor
- VectorVest, Inc.
- Executive Premier Workshop
- One-Day Options Course
- OptionsPro
- Retirement Income Workshop
- Sure-Fire Trading Systems (VectorVest, Inc.)
- Trading as a Business Workshop
- VectorVest 7 EOD
- VectorVest 7 RealTime/IntraDay
- VectorVest AutoTester
- VectorVest Educational Services
- VectorVest OnLine
- VectorVest Options Analyzer
- VectorVest ProGraphics v6.0
- VectorVest ProTrader 7
- VectorVest RealTime Derby Tool
- VectorVest Simulator
- VectorVest Variator
- VectorVest Watchdog
