HOT TOPICS LIST
- MACD
- Fibonacci
- RSI
- Gann
- ADXR
- Stochastics
- Volume
- Triangles
- Futures
- Cycles
- Volatility
- ZIGZAG
- MESA
- Retracement
- Aroon
INDICATORS LIST
LIST OF TOPICS
PRINT THIS ARTICLE
by Chaitali Mohile
With a piercing line pattern formed, MXI suggests a new bullish rally.
Position: Buy
Chaitali Mohile
Active trader in the Indian stock markets since 2003 and a full-time writer. Trading is largely based upon technical analysis.
PRINT THIS ARTICLE
CANDLESTICK CHARTING
MXI Forms Potential Bottom
11/21/07 10:57:43 AMby Chaitali Mohile
With a piercing line pattern formed, MXI suggests a new bullish rally.
Position: Buy
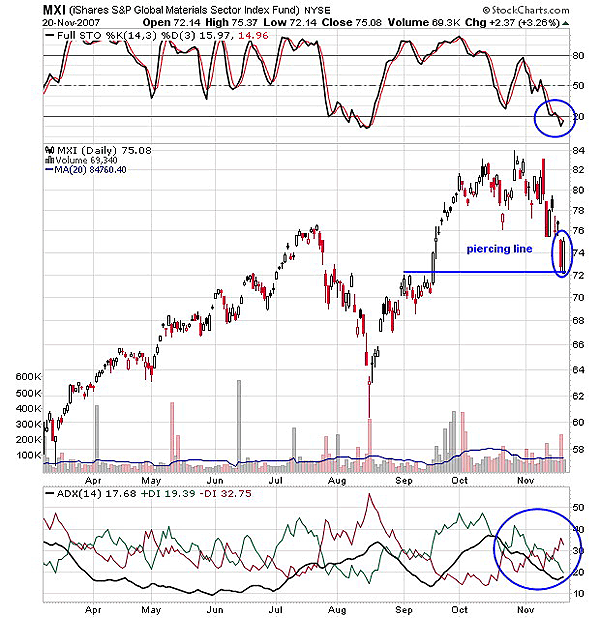
| The piercing line seen in Figure 1 is a two-day bullish reversal pattern that occurs in a downward trending market. In a two-day pattern, the pattern is formed with two candles; the first is a red/black candle of an existing downtrend, and the second is a white opening below the low of the previous day. The white candle suggests the new uptrend. The psychology behind this pattern, as explained by Gregory Morris in Candlestick Charting Explained is, the close of a bullish candle being above the midpoint of the long red/black candle causes concern for the bears and indicates a potential bottom formed after a downside rally. MXI, in its daily chart, forms a similar bottom. |
| MXI has a critical downward move of 12 points. Though it was a correction move, the index was highly volatile with an uncertain range during the move. The rally is filled with various dojis, large bearish as well as bullish candles, trapping larger trades. A piercing line finally formed on the chart on a prior bullish breakout level. In mid-September, the resistance level at 72 was turned to support and the rally surged to 84, with this level forming a base for the next bullish rally. So the stock stands on a healthy support that could lead to an upside move. Of the two indicators used, one is a momentum indicator, while the other is a trend indicator for better trading direction. |

|
| FIGURE 1: MXI, DAILY. MXI forms a piercing line pattern on the previous breakout support. The oversold stochastic 14,3,3) indicates the end of a downward rally. The ADX (14) shows bulls and bears struggling to win the trend. |
| Graphic provided by: StockCharts.com. |
| |
| The stochastic (14,3,3) after lower highs and lower lows turned highly oversold below 20, and the price has rested on a support line coinciding with the piercing line pattern. This suggests that the stochastic could move above 20 and a strong bullish rally is likely. However, the average directional moving index (ADX) (14) does not give any clear trend indications. The indicator has been highly volatile throughout the rally, and the current position of -DI and +DI (directional index) suggests shaky moves to continue. |
| Traders should carefully observe price action along the piercing line and the oversold stochastic (14,3,3); some volatility is likely as indicated by the ADX (14). If prices did rise above the piercing line you could consider a long position with a stop-loss at 72 (support line). |
Active trader in the Indian stock markets since 2003 and a full-time writer. Trading is largely based upon technical analysis.
| Company: | Independent |
| Address: | C1/3 Parth Indraprasth Towers. Vastrapur |
| Ahmedabad, Guj 380015 | |
| E-mail address: | chaitalimohile@yahoo.co.in |
Traders' Resource Links | |
| Independent has not added any product or service information to TRADERS' RESOURCE. | |
Click here for more information about our publications!
Comments
Date: 11/25/07Rank: 5Comment:

Request Information From Our Sponsors
- VectorVest, Inc.
- Executive Premier Workshop
- One-Day Options Course
- OptionsPro
- Retirement Income Workshop
- Sure-Fire Trading Systems (VectorVest, Inc.)
- Trading as a Business Workshop
- VectorVest 7 EOD
- VectorVest 7 RealTime/IntraDay
- VectorVest AutoTester
- VectorVest Educational Services
- VectorVest OnLine
- VectorVest Options Analyzer
- VectorVest ProGraphics v6.0
- VectorVest ProTrader 7
- VectorVest RealTime Derby Tool
- VectorVest Simulator
- VectorVest Variator
- VectorVest Watchdog
- StockCharts.com, Inc.
- Candle Patterns
- Candlestick Charting Explained
- Intermarket Technical Analysis
- John Murphy on Chart Analysis
- John Murphy's Chart Pattern Recognition
- John Murphy's Market Message
- MurphyExplainsMarketAnalysis-Intermarket Analysis
- MurphyExplainsMarketAnalysis-Visual Analysis
- StockCharts.com
- Technical Analysis of the Financial Markets
- The Visual Investor
