HOT TOPICS LIST
- MACD
- Fibonacci
- RSI
- Gann
- ADXR
- Stochastics
- Volume
- Triangles
- Futures
- Cycles
- Volatility
- ZIGZAG
- MESA
- Retracement
- Aroon
INDICATORS LIST
LIST OF TOPICS
PRINT THIS ARTICLE
by Chaitali Mohile
After experiencing a volatile rally, Ford has moved back to the level of its previous congestion area, which is now the support area of the next rally.
Position: N/A
Chaitali Mohile
Active trader in the Indian stock markets since 2003 and a full-time writer. Trading is largely based upon technical analysis.
PRINT THIS ARTICLE
CONSOLID FORMATION
Ford Motor Retraces To Support Zone
11/20/07 10:04:39 AMby Chaitali Mohile
After experiencing a volatile rally, Ford has moved back to the level of its previous congestion area, which is now the support area of the next rally.
Position: N/A
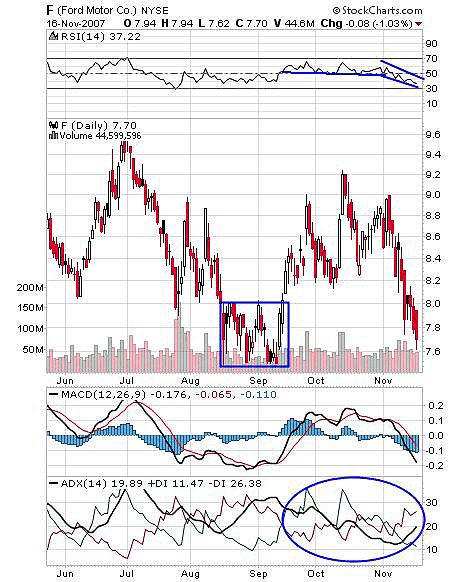
| In Figure 1, you can see that Ford Motor has moved in a $2 range ($7.60 to $9.60), which has proved to be highly volatile. In addition, the stock entered into a congestion period after a declining rally from $9.60 to $7.60 to accumulate strength for a further bullish rally. All three indicators also confirm this volatile rally; the relative strength index (RSI) (14) is unable to sustain above the 50 level, rallying in no-man's land and remaining range-bound in the 30-50 territory, while price was approaching the lower level of the range. As price consolidated, notice the tangled movement of the positive directional index (+DI) and the negative directional index (-DI) in ADX (14) while the moving average convergence/divergence (MACD)(12,26,9) is unable to stabilize in one particular territory. |

|
| FIGURE 1: FORD MOTOR, DAILY. All the indicators are weak, and Ford has retraced back to strong support area, which earlier was the congestion zone. |
| Graphic provided by: StockCharts.com. |
| |
| With a breakout from the congestion area, the stock rallied to $9.20 but due to high volatility the price ran out of its bull run and retraced back to the support area -- that is, the congestion area. Along with the price, all three indicators are back to previous bearish areas. With the congestion area being a strong support zone, the stock is most likely to uphold this support on a recent bearish rally. The ADX (14) since mid-October has again turned volatile with +DI and -DI moving at equal pace, so the ADX (14) is neither in favor of bulls nor of bears. |

|
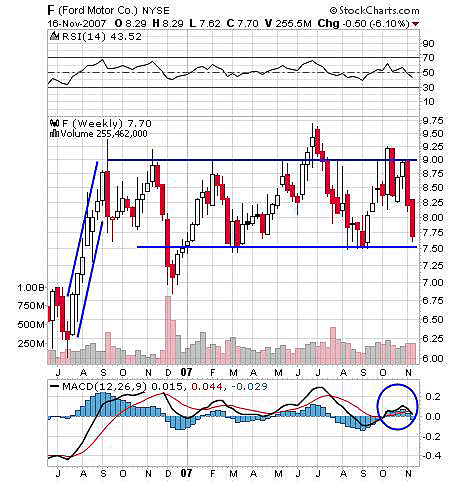
| FIGURE 2: FORD MOTOR, WEEKLY. Note the flag & pennant formation, with the flag extended in 2007 and still stable. |
| Graphic provided by: StockCharts.com. |
| |
| Figure 2 gives a clearer picture of the stock's movement. The medium-term chart shows a longer consolidation period of the stock. After the advance rally from $6.25 to $9, the stock has entered a wide consolidation range, forming the flag & pennant continuation pattern. This explains the reason for the volatile rally see in the daily chart in Figure 1. Since mid-2006 the stock has been consolidating, and the range is wide enough to trade. The chart shows good volume for long and short positions by traders. The support level of $7.60-7.75 is actually the lower level of a longer consolidation, thus reconfirming the strength and importance of this level, establishing that the support on the current downside rally is equally important. The moving average convergence/divergence (MACD) (12,26,9) is on edge to turn bearish and the relative strength index (RSI)(14) is moderately below the 50 level, so that needs to be watched carefully. |

|
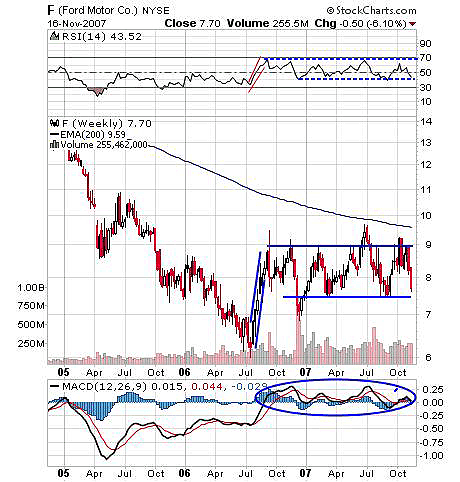
| FIGURE 3: FORD MOTOR, WEEKLY. Ford has consolidated after the advance rally that followed a huge correction from higher levels. |
| Graphic provided by: StockCharts.com. |
| |
| Figure 3, a longer period, suggests that this consolidation is on the lower side after a minor advance rally followed by an extensive downside journey, so we know the target on the breakout. The RSI(14) has formed a flag & pennant formation, but the MACD (12,26,9) still shows a volatile rally. However, the importance of the support level is clear to anticipate the next upside surge. Traders may trade this range with low leverage due to high volume, but be on the lookout for a breakout. The breakout will first see the resistance of a 200-day moving average, but later may ride a long bull run. |
| The current approaching support of $7.60 is a critical point. Will prices reverse after hitting this support and start moving up towards the top of the consolidation range or will they break down below the support level to fall even further? |
Active trader in the Indian stock markets since 2003 and a full-time writer. Trading is largely based upon technical analysis.
| Company: | Independent |
| Address: | C1/3 Parth Indraprasth Towers. Vastrapur |
| Ahmedabad, Guj 380015 | |
| E-mail address: | chaitalimohile@yahoo.co.in |
Traders' Resource Links | |
| Independent has not added any product or service information to TRADERS' RESOURCE. | |
Click here for more information about our publications!
Comments
Date: 11/25/07Rank: 3Comment:
Date: 11/26/07Rank: 5Comment: Life is a teacher, the more we live the more we learn.
Stanley Okun

|

Request Information From Our Sponsors
- StockCharts.com, Inc.
- Candle Patterns
- Candlestick Charting Explained
- Intermarket Technical Analysis
- John Murphy on Chart Analysis
- John Murphy's Chart Pattern Recognition
- John Murphy's Market Message
- MurphyExplainsMarketAnalysis-Intermarket Analysis
- MurphyExplainsMarketAnalysis-Visual Analysis
- StockCharts.com
- Technical Analysis of the Financial Markets
- The Visual Investor
- VectorVest, Inc.
- Executive Premier Workshop
- One-Day Options Course
- OptionsPro
- Retirement Income Workshop
- Sure-Fire Trading Systems (VectorVest, Inc.)
- Trading as a Business Workshop
- VectorVest 7 EOD
- VectorVest 7 RealTime/IntraDay
- VectorVest AutoTester
- VectorVest Educational Services
- VectorVest OnLine
- VectorVest Options Analyzer
- VectorVest ProGraphics v6.0
- VectorVest ProTrader 7
- VectorVest RealTime Derby Tool
- VectorVest Simulator
- VectorVest Variator
- VectorVest Watchdog
