

HOT TOPICS LIST
- MACD
- Fibonacci
- RSI
- Gann
- ADXR
- Stochastics
- Volume
- Triangles
- Futures
- Cycles
- Volatility
- ZIGZAG
- MESA
- Retracement
- Aroon
INDICATORS LIST
LIST OF TOPICS
PRINT THIS ARTICLE
by Chaitali Mohile
The stock has violated most of the strong resistance, marking its all-time high, but the indicators on daily and weekly charts may keep the breakout under pressure.
Position: N/A
Chaitali Mohile
Active trader in the Indian stock markets since 2003 and a full-time writer. Trading is largely based upon technical analysis.
PRINT THIS ARTICLE
BREAKOUTS
Saul Centers Breakout Is Under Pressure
11/19/07 12:06:20 PMby Chaitali Mohile
The stock has violated most of the strong resistance, marking its all-time high, but the indicators on daily and weekly charts may keep the breakout under pressure.
Position: N/A
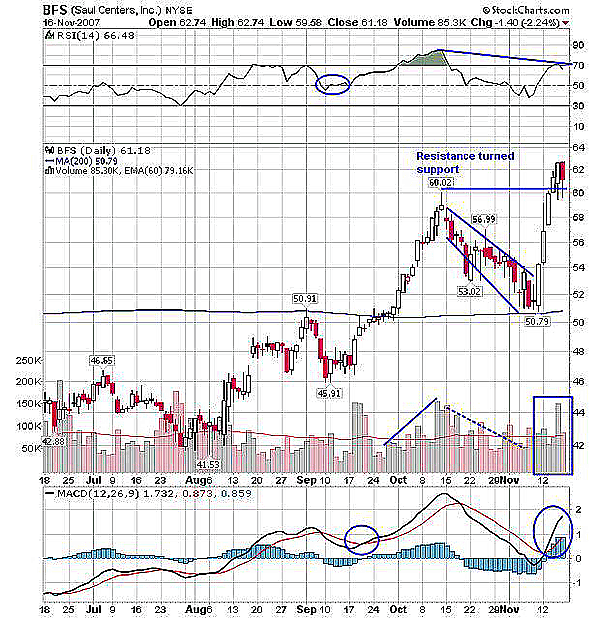
| The advance rally from 50.51 to 60.02 was aborted by the shooting star pattern. The shooting star is not a major reversal pattern, but it did terminate the uptrend and initiated a new downside move. This bullish trend formed a strong support at 50.51, which if violated would turn the trend down. The shooting star in Figure 1 formed at a higher level, pulling the relative strength index (RSI)(14) to a highly overbought zone. The oscillator failed to hold onto an overbought situation and started declining, therefore reconfirming the termination of this bullish rally. Eventually, the stock has retraced back to its previous resistance, turning to a support of 50.91. This corrective rally gave away entire gains of a prior upside surge but established strong support at the 50 level. |
|
| FIGURE 1: BFS, DAILY. The negative divergence on RSI (14) would slow down the bullish rally, which began on heavy volume. |
| Graphic provided by: StockCharts.com. |
| |
| The stock moved on with a second attempt to retest the high at 60.02. This was accompanied by healthy volume and a bullish RSI (14) support. In addition, the moving average convergence/divergence (MACD) (12,26,9) turned highly positive after a bullish breakout in positive territory. The indicator since August has settled in positive territory, undergoing bullish and bearish crossovers. This upward rally reached its 52-week high on heavy volume breaking through its prior high pivot. The rally headed on positive terms, with three white soldiers carrying the rally above a previous high of 60.02, and bullish support of both the indicators. But now the price has reached its new high, whereas the RSI (14) has negative divergence. This divergence may weaken the rally instead of carrying it to higher levels. |
| Except for this negative divergence, the big picture on the daily chart is bullish, so the result might not be too harsh but may slow down the rally. The recent support at 60.02 has to be maintained for the bullish rally to remain intact. The MACD (12,26,9) is positively supporting the bullish move, so my only concern is negative divergence in Figure 1. |
|
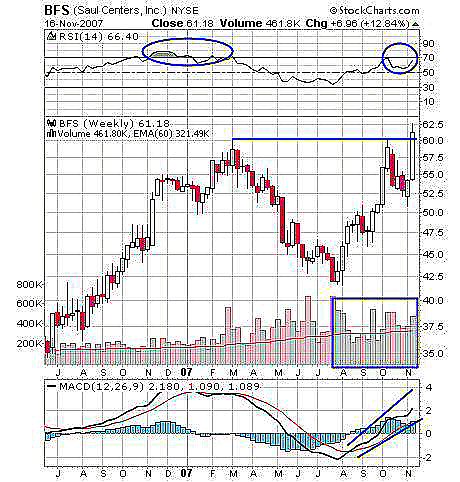
| FIGURE 2: BFS, WEEKLY. The future stability of the bullish rally above 62.50 depends on the direction of RSI (14). |
| Graphic provided by: StockCharts.com. |
| |
| Second, the RSI (14) on the weekly chart attracted my attention and made me more cautious on the upside swing (Figure 2). On previous bullish rides (35 to 55 levels), the RSI (14) failed to move above 80, and as a result the rally entered sideways consolidation for a few months. Later the trend regained the strength and surged to higher levels at 60, with the RSI (14) facing the resistance of 70. The stock retraced back to 42. Now back to the present rally, the recent weekly candle has closed above its strong resistance again on encouraging volume. The MACD (12,26,9) is positive for the bullish rally to run ahead, but watch out for the RSI (14) level. The RSI (14) is approaching its resistance levels, so it is likely for the rally to face some turbulence while crossing this hurdle. |
| The stock might enter consolidation before breaking out of the resistance level. For more reference I referred to the long-term chart and was surprised to find a similar picture of the RSI (14) reaction. I would recommend traders to take their profits on the rally, as the weak RSI (14) may result in sideways reaction move. Profit-taking after any extensive one-sided movement is wise. |
Active trader in the Indian stock markets since 2003 and a full-time writer. Trading is largely based upon technical analysis.
| Company: | Independent |
| Address: | C1/3 Parth Indraprasth Towers. Vastrapur |
| Ahmedabad, Guj 380015 | |
| E-mail address: | chaitalimohile@yahoo.co.in |
Traders' Resource Links | |
| Independent has not added any product or service information to TRADERS' RESOURCE. | |
Click here for more information about our publications!
Comments
Date:�11/20/07Rank:�2Comment:�
Date:�11/25/07Rank:�4Comment:�

Request Information From Our Sponsors
- StockCharts.com, Inc.
- Candle Patterns
- Candlestick Charting Explained
- Intermarket Technical Analysis
- John Murphy on Chart Analysis
- John Murphy's Chart Pattern Recognition
- John Murphy's Market Message
- MurphyExplainsMarketAnalysis-Intermarket Analysis
- MurphyExplainsMarketAnalysis-Visual Analysis
- StockCharts.com
- Technical Analysis of the Financial Markets
- The Visual Investor
- VectorVest, Inc.
- Executive Premier Workshop
- One-Day Options Course
- OptionsPro
- Retirement Income Workshop
- Sure-Fire Trading Systems (VectorVest, Inc.)
- Trading as a Business Workshop
- VectorVest 7 EOD
- VectorVest 7 RealTime/IntraDay
- VectorVest AutoTester
- VectorVest Educational Services
- VectorVest OnLine
- VectorVest Options Analyzer
- VectorVest ProGraphics v6.0
- VectorVest ProTrader 7
- VectorVest RealTime Derby Tool
- VectorVest Simulator
- VectorVest Variator
- VectorVest Watchdog