HOT TOPICS LIST
- MACD
- Fibonacci
- RSI
- Gann
- ADXR
- Stochastics
- Volume
- Triangles
- Futures
- Cycles
- Volatility
- ZIGZAG
- MESA
- Retracement
- Aroon
INDICATORS LIST
LIST OF TOPICS
PRINT THIS ARTICLE
by Mike Carr, CMT
Different analysts can see different patterns in charts, but all analysts should agree on whether the patterns are bullish or bearish.
Position: Buy
Mike Carr, CMT
Mike Carr, CMT, is a member of the Market Technicians Association, and editor of the MTA's newsletter, Technically Speaking. He is also the author of "Smarter Investing in Any Economy: The Definitive Guide to Relative Strength Investing," and "Conquering the Divide: How to Use Economic Indicators to Catch Stock Market Trends."
PRINT THIS ARTICLE
CHART ANALYSIS
Armstrong World Industries: It's The Pattern, Not The Name, That Matters
11/20/07 08:26:17 AMby Mike Carr, CMT
Different analysts can see different patterns in charts, but all analysts should agree on whether the patterns are bullish or bearish.
Position: Buy
| Armstrong World Industries, Inc. (AWI), is a global leader in the design and manufacture of floors, ceilings, and cabinets, and has been in business since 1860. In 2006, Armstrong's net sales totaled approximately $3.4 billion. Armstrong operates 40 plants in 10 countries and has approximately 13,000 employees worldwide. It's a company that has probably been hurt by the housing slowdown but should recover quickly as remodeling replaces property-flipping for homeowners. |
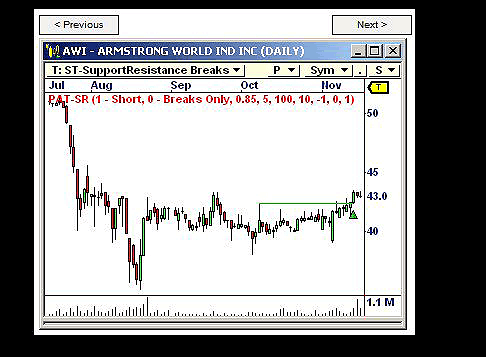
| Recently, the stock broke out of resistance and looks like it just broke out of a classic cup-with-handle pattern (Figure 1). Popularized by William O'Neil in the 1990s, this pattern is a favorite of momentum investors. Many traders learn only a few patterns and look for them in charts, expecting that they will soon discover the path to riches this way. But the cup-with-handle formation is a bullish continuation pattern and should occur after an up move. In Figure 1, we see that AWI has formed a base after a decline. |

|
| FIGURE 1: ARMSTRONG WORLD INDUSTRIES, DAILY. Here, it looks as if the stock broke out of a classic cup-with-handle pattern. |
| Graphic provided by: www.patternscans.com. |
| |
| We could also call the basing pattern that formed over the past 15 weeks as a scallop formation. This pattern is identified by finding two price peaks with a rounded valley between the peaks. There are two scallop patterns in this chart, one short one forming from August into September 2007 and the second forming between September and November. |
| If we ignore the brief price rise that occurred in September, we could call the pattern a rounding bottom. This highlights a problem with chart analysis — subjective interpretation of price action leads different analysts to describe the same chart in different terms. The important thing to notice on this chart is that price has moved in a tight range for nearly four months. In the past week, it broke above the previous resistance level on heavy volume. This is bullish; it doesn't matter how you describe it, AWI represents a good buy with an easily identified stop three points below the breakout price. |
Mike Carr, CMT, is a member of the Market Technicians Association, and editor of the MTA's newsletter, Technically Speaking. He is also the author of "Smarter Investing in Any Economy: The Definitive Guide to Relative Strength Investing," and "Conquering the Divide: How to Use Economic Indicators to Catch Stock Market Trends."
| Website: | www.moneynews.com/blogs/MichaelCarr/id-73 |
| E-mail address: | marketstrategist@gmail.com |
Click here for more information about our publications!
Comments
Date: 11/25/07Rank: 3Comment:

Request Information From Our Sponsors
- StockCharts.com, Inc.
- Candle Patterns
- Candlestick Charting Explained
- Intermarket Technical Analysis
- John Murphy on Chart Analysis
- John Murphy's Chart Pattern Recognition
- John Murphy's Market Message
- MurphyExplainsMarketAnalysis-Intermarket Analysis
- MurphyExplainsMarketAnalysis-Visual Analysis
- StockCharts.com
- Technical Analysis of the Financial Markets
- The Visual Investor
- VectorVest, Inc.
- Executive Premier Workshop
- One-Day Options Course
- OptionsPro
- Retirement Income Workshop
- Sure-Fire Trading Systems (VectorVest, Inc.)
- Trading as a Business Workshop
- VectorVest 7 EOD
- VectorVest 7 RealTime/IntraDay
- VectorVest AutoTester
- VectorVest Educational Services
- VectorVest OnLine
- VectorVest Options Analyzer
- VectorVest ProGraphics v6.0
- VectorVest ProTrader 7
- VectorVest RealTime Derby Tool
- VectorVest Simulator
- VectorVest Variator
- VectorVest Watchdog
