HOT TOPICS LIST
- MACD
- Fibonacci
- RSI
- Gann
- ADXR
- Stochastics
- Volume
- Triangles
- Futures
- Cycles
- Volatility
- ZIGZAG
- MESA
- Retracement
- Aroon
INDICATORS LIST
LIST OF TOPICS
PRINT THIS ARTICLE
by David Penn
A series of bullish sessions took COMEX silver on a 30 cent per ounce ride in January. Was an overbought relative strength index reason to worry?
Position: N/A
David Penn
Technical Writer for Technical Analysis of STOCKS & COMMODITIES magazine, Working-Money.com, and Traders.com Advantage.
PRINT THIS ARTICLE
FLAGS AND PENNANTS
Silver's Overbought Pennant
02/07/01 08:09:10 AMby David Penn
A series of bullish sessions took COMEX silver on a 30 cent per ounce ride in January. Was an overbought relative strength index reason to worry?
Position: N/A
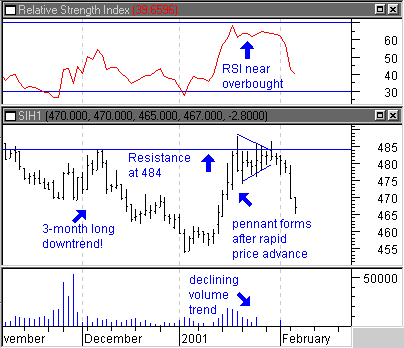
| What goes up must come down. And what has been trending down for more than a year might be nearing a bottom, right? Such is the sort of "commonsensical" thinking that can get investors and traders into trouble. I was watching the March contract for COMEX silver make a sharp move upward in January when "commonsense" began to leak like radon into my brain. I noted that silver had been trending down for all of 2000, after a narrowing, lackluster 1999. In particular, I was drawn to March silver's January pennant, which seemed to suggest that silver might have reached a bottom and that a rally might be just around the corner. |
| At the time, the only pause I had (technically speaking) was a relative strength index that suggested silver might not have much more upside in the near-term. The pennant itself seemed sound (except for one major factor I'll mention in a moment), coming with a declining volume trend and the trademark rapid price rise into the pattern of lower highs and higher lows shown by the two converging trendlines. If you can't tell by now, I thought I had this one nailed. The nearest top-side resistance appeared to be at $4.98 which, considered with my price objective of about $5.02 (formation size added to the highest point in the formation), seemed like a reasonable fit. |

|
| An overbought RSI and the failure of prices to close above resistance at $4.84 per ounce helped this pennant break out on the downside instead of up. |
| Graphic provided by: MetaStock. |
| |
| In the aftermath, as silver broke out of the pennant on the downside, it is easy to court hindsight. But here, the problem with the trade could likely have been caught. Pennants (and their cousins, flags) are continuation patterns, and as such suggest resumption of the prevailing trend--or at least of the trend that led up to the formation. The key words are "led up", however, and that is where my analysis broke down. |
| While there were significant upmoves leading into the pennant, the strong, three-month downtrend leading to those up moves meant that any sustained upward movement was going to be a countertrend, and thus very tricky to trade with. Additionally, as dramatic as the up moves were in mid to late January, prices breached but never closed above $4.84, the most recent high occurring in December. This very real resistance at $4.84 was another signal that an upside breakout from the January pennant was going to be difficult, if possible at all. |
| One of the factors I did observe early--only to discount it--was the fact that the relative strength index was near overbought levels during the formation of the pennant. While this alone should not have necessarily caused me to rule out an upside breakout (new upward trends often register "overbought" readings at first), it could have limited significantly the upside breakout potential of the pennant. Many technical analysts (though Jack Schwager comes most immediately to mind in this context) talk about the value of failed patterns and misread signals in helping shape one's continuing technical analysis education. This case of silver's overbought pennant was a good reminder to me that even the best looking patterns must be in the right places in order to make profits. |
Technical Writer for Technical Analysis of STOCKS & COMMODITIES magazine, Working-Money.com, and Traders.com Advantage.
| Title: | Technical Writer |
| Company: | Technical Analysis, Inc. |
| Address: | 4757 California Avenue SW |
| Seattle, WA 98116 | |
| Phone # for sales: | 206 938 0570 |
| Fax: | 206 938 1307 |
| Website: | www.Traders.com |
| E-mail address: | DPenn@traders.com |
Traders' Resource Links | |
| Charting the Stock Market: The Wyckoff Method -- Books | |
| Working-Money.com -- Online Trading Services | |
| Traders.com Advantage -- Online Trading Services | |
| Technical Analysis of Stocks & Commodities -- Publications and Newsletters | |
| Working Money, at Working-Money.com -- Publications and Newsletters | |
| Traders.com Advantage -- Publications and Newsletters | |
| Professional Traders Starter Kit -- Software | |
Click here for more information about our publications!
Comments
Date: 02/13/01Rank: 5Comment:

Request Information From Our Sponsors
- StockCharts.com, Inc.
- Candle Patterns
- Candlestick Charting Explained
- Intermarket Technical Analysis
- John Murphy on Chart Analysis
- John Murphy's Chart Pattern Recognition
- John Murphy's Market Message
- MurphyExplainsMarketAnalysis-Intermarket Analysis
- MurphyExplainsMarketAnalysis-Visual Analysis
- StockCharts.com
- Technical Analysis of the Financial Markets
- The Visual Investor
- VectorVest, Inc.
- Executive Premier Workshop
- One-Day Options Course
- OptionsPro
- Retirement Income Workshop
- Sure-Fire Trading Systems (VectorVest, Inc.)
- Trading as a Business Workshop
- VectorVest 7 EOD
- VectorVest 7 RealTime/IntraDay
- VectorVest AutoTester
- VectorVest Educational Services
- VectorVest OnLine
- VectorVest Options Analyzer
- VectorVest ProGraphics v6.0
- VectorVest ProTrader 7
- VectorVest RealTime Derby Tool
- VectorVest Simulator
- VectorVest Variator
- VectorVest Watchdog
