

HOT TOPICS LIST
- MACD
- Fibonacci
- RSI
- Gann
- ADXR
- Stochastics
- Volume
- Triangles
- Futures
- Cycles
- Volatility
- ZIGZAG
- MESA
- Retracement
- Aroon
INDICATORS LIST
LIST OF TOPICS
PRINT THIS ARTICLE
by Arthur Hill
Qualcomm appeared to break down with a gap in early November, but the stock countered with a gap up and follow-through above resistance would be bullish.
Position: Accumulate
Arthur Hill
Arthur Hill is currently editor of TDTrader.com, a website specializing in trading strategies, sector/industry specific breadth stats and overall technical analysis. He passed the Society of Technical Analysts (STA London) diploma exam with distinction is a Certified Financial Technician (CFTe). Prior to TD Trader, he was the Chief Technical Analyst for Stockcharts.com and the main contributor to the ChartSchool.
PRINT THIS ARTICLE
ISLAND REVERSAL
QCOM Reverses With Gaps
11/15/07 02:26:56 PMby Arthur Hill
Qualcomm appeared to break down with a gap in early November, but the stock countered with a gap up and follow-through above resistance would be bullish.
Position: Accumulate
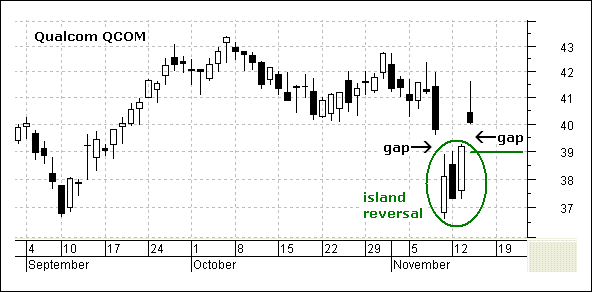
| Qualcomm (QCOM) formed an island reversal over the last six trading days. The stock gapped down below 39, consolidated for three days, and then gapped above 40. The two gaps created a price island and traders establishing short positions are now stranded with losses. See Figure 1. |
|
| FIGURE 1: QCOM. Qualcom gapped down below 39, consolidated for three days and then gapped above 40. |
| Graphic provided by: MetaStock. |
| |
| The island reversal is a short-term bullish reversal pattern. The first gap shows extreme selling pressure, and this is bearish. This down gap was countered by gap up that shows extreme buying pressure. A chart is only as good as its last gap. The second gap is bullish as long as it holds. Traders should look for a move below 39 to negate this signal. |
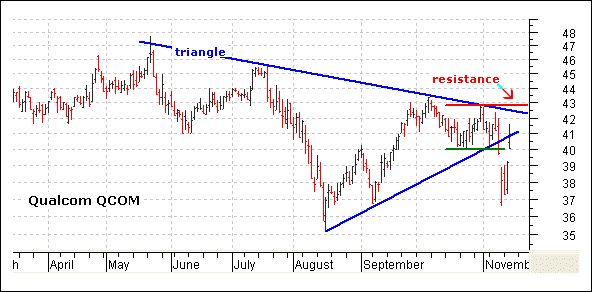
| Turning to a longer-term picture, QCOM formed a large triangle over the last few months. As you can see from Figure 2, the support break at 40 and gap down triggered a bearish signal. However, this was reversed with the second gap and island reversal. Talk about a whipsaw! Qualcomm is back within a four-week trading range and it is like the stock never dipped below 40. |
|
| FIGURE 2: QCOM. The support break at 40 and gap down triggered a bearish signal. |
| Graphic provided by: MetaStock. |
| |
| The upper triangle trendline and the late October high combine to mark resistance at 43 (red line). While the island reversal is short-term bullish, a break above 43 is needed to turn medium-term bullish. This would break the May trendline and argue for a challenge to resistance from the May-July highs (46-48). |
Arthur Hill is currently editor of TDTrader.com, a website specializing in trading strategies, sector/industry specific breadth stats and overall technical analysis. He passed the Society of Technical Analysts (STA London) diploma exam with distinction is a Certified Financial Technician (CFTe). Prior to TD Trader, he was the Chief Technical Analyst for Stockcharts.com and the main contributor to the ChartSchool.
| Title: | Editor |
| Company: | TDTrader.com |
| Address: | Willem Geetsstraat 17 |
| Mechelen, B2800 | |
| Phone # for sales: | 3215345465 |
| Website: | www.tdtrader.com |
| E-mail address: | arthurh@tdtrader.com |
Traders' Resource Links | |
| TDTrader.com has not added any product or service information to TRADERS' RESOURCE. | |
Click here for more information about our publications!
Comments
Date:�11/20/07Rank:�4Comment:�
Date:�11/25/07Rank:�5Comment:�

Request Information From Our Sponsors
- StockCharts.com, Inc.
- Candle Patterns
- Candlestick Charting Explained
- Intermarket Technical Analysis
- John Murphy on Chart Analysis
- John Murphy's Chart Pattern Recognition
- John Murphy's Market Message
- MurphyExplainsMarketAnalysis-Intermarket Analysis
- MurphyExplainsMarketAnalysis-Visual Analysis
- StockCharts.com
- Technical Analysis of the Financial Markets
- The Visual Investor
- VectorVest, Inc.
- Executive Premier Workshop
- One-Day Options Course
- OptionsPro
- Retirement Income Workshop
- Sure-Fire Trading Systems (VectorVest, Inc.)
- Trading as a Business Workshop
- VectorVest 7 EOD
- VectorVest 7 RealTime/IntraDay
- VectorVest AutoTester
- VectorVest Educational Services
- VectorVest OnLine
- VectorVest Options Analyzer
- VectorVest ProGraphics v6.0
- VectorVest ProTrader 7
- VectorVest RealTime Derby Tool
- VectorVest Simulator
- VectorVest Variator
- VectorVest Watchdog