HOT TOPICS LIST
- MACD
- Fibonacci
- RSI
- Gann
- ADXR
- Stochastics
- Volume
- Triangles
- Futures
- Cycles
- Volatility
- ZIGZAG
- MESA
- Retracement
- Aroon
INDICATORS LIST
LIST OF TOPICS
PRINT THIS ARTICLE
by Chaitali Mohile
Disk Drive Index moves completely against the direction of the financial market. The index is forming descending triangles on its long-term chart.
Position: N/A
Chaitali Mohile
Active trader in the Indian stock markets since 2003 and a full-time writer. Trading is largely based upon technical analysis.
PRINT THIS ARTICLE
DESCENDING TRIANGLES
Disk Drive Index Moves Against Markets
11/14/07 01:42:47 PMby Chaitali Mohile
Disk Drive Index moves completely against the direction of the financial market. The index is forming descending triangles on its long-term chart.
Position: N/A
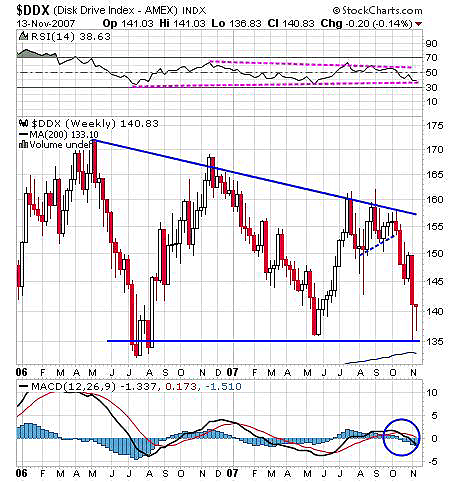
| Since mid-2006, Disk Drive Index ($DDX) is in a different mood, constructing the series of lower highs and stable lower levels. On Figure 1, this series is not easily identified because of its broader range and single directional movement. Initially, the range was 50 points wider, with more lower highs, narrowing the angle. And now descending triangles are being formed on the weekly and the monthly charts too. This pattern is a bearish formation and is also identified as a triangular consolidation zone. |
| In Figure 1, 170-165-160 is the order of lower highs series whereas the low is stable at 135 levels. The upper trendline joins these lower highs and slopes downward. This is known as a seller's line, while the lower trendline is called a buyer's line. Though it's a consolidation zone, the range being largely wide, it is easily traded till the triangle matures. For the weekly chart, the trading range is 155-135, and now current turbulence has drifted the index toward its lower range at 135. Under any circumstance, if this low gets violated before maturity, then the breakout is confirmed and the index may enter in a new downtrend. Earlier, the relative strength index (RSI)(14) had bounced to a bullish mood from the 35 level; the RSI (14) indicates some possibility of a pullback rally. Meanwhile, the moving average convergence/divergence (MACD) has a bearish crossover moving marginally below its zero line. |

|
| FIGURE 1: $DDX, WEEKLY. A small symmetrical triangle is formed within a descending triangle. The breakdown of the symmetrical triangle established support at 135. The rally between the buyer's line and the seller's line can be traded following both the indicators' directions and positions. |
| Graphic provided by: StockCharts.com. |
| |
| The triangle has not yet matured, so following the indicator and price movements, traders can enter long positions with a stop-loss at 130. This five-point tolerance is essential, as the pattern can give a breakout and rush back to lower highs, whipsawing the long positions. But on the weekly chart, traders should observe a medium-term target of the downward-sloping line (seller's line). |

|
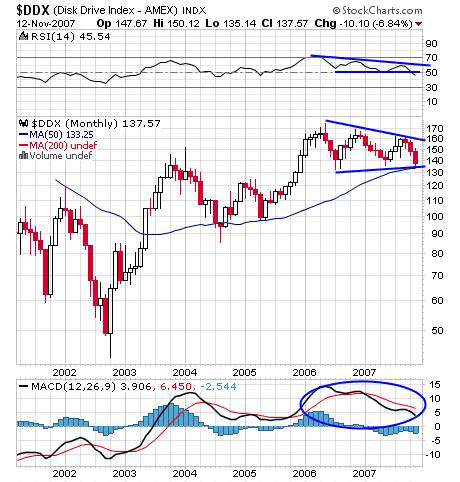
| FIGURE 2: $DDX, MONTHLY. The descending triangle being formed reinforces the pattern. The MACD (12,26,9) still manages to be sustained in positive territory. |
| Graphic provided by: StockCharts.com. |
| |
| Next is a long-term (monthly) chart (Figure 2), where you can easily identify the seller's and buyer's line. In fact, the pattern on the monthly chart encouraged me to analyze other charts. On the monthly chart the RSI (14) moved within a narrow range, forming a descending triangle. Both the indicators are moderately bullish and do not highlight any signs of early breakout. The breakout of a descending triangle is reinforced as the same pattern is formed on two different time frames. |
| Since the descending triangle is a bearish formation, a breakdown will initiate a new downtrend. Shorting the index could be a good option. The long trade should be followed with a tight stop-loss. |
Active trader in the Indian stock markets since 2003 and a full-time writer. Trading is largely based upon technical analysis.
| Company: | Independent |
| Address: | C1/3 Parth Indraprasth Towers. Vastrapur |
| Ahmedabad, Guj 380015 | |
| E-mail address: | chaitalimohile@yahoo.co.in |
Traders' Resource Links | |
| Independent has not added any product or service information to TRADERS' RESOURCE. | |
Click here for more information about our publications!
Comments

Request Information From Our Sponsors
- StockCharts.com, Inc.
- Candle Patterns
- Candlestick Charting Explained
- Intermarket Technical Analysis
- John Murphy on Chart Analysis
- John Murphy's Chart Pattern Recognition
- John Murphy's Market Message
- MurphyExplainsMarketAnalysis-Intermarket Analysis
- MurphyExplainsMarketAnalysis-Visual Analysis
- StockCharts.com
- Technical Analysis of the Financial Markets
- The Visual Investor
- VectorVest, Inc.
- Executive Premier Workshop
- One-Day Options Course
- OptionsPro
- Retirement Income Workshop
- Sure-Fire Trading Systems (VectorVest, Inc.)
- Trading as a Business Workshop
- VectorVest 7 EOD
- VectorVest 7 RealTime/IntraDay
- VectorVest AutoTester
- VectorVest Educational Services
- VectorVest OnLine
- VectorVest Options Analyzer
- VectorVest ProGraphics v6.0
- VectorVest ProTrader 7
- VectorVest RealTime Derby Tool
- VectorVest Simulator
- VectorVest Variator
- VectorVest Watchdog
