HOT TOPICS LIST
- MACD
- Fibonacci
- RSI
- Gann
- ADXR
- Stochastics
- Volume
- Triangles
- Futures
- Cycles
- Volatility
- ZIGZAG
- MESA
- Retracement
- Aroon
INDICATORS LIST
LIST OF TOPICS
PRINT THIS ARTICLE
by Chaitali Mohile
There were more than two bearish reversal signals that indicated a breakdown on charts of two different time frames.
Position: N/A
Chaitali Mohile
Active trader in the Indian stock markets since 2003 and a full-time writer. Trading is largely based upon technical analysis.
PRINT THIS ARTICLE
CHART ANALYSIS
Bears Ruling NASDAQ Composite
11/13/07 09:21:26 AMby Chaitali Mohile
There were more than two bearish reversal signals that indicated a breakdown on charts of two different time frames.
Position: N/A
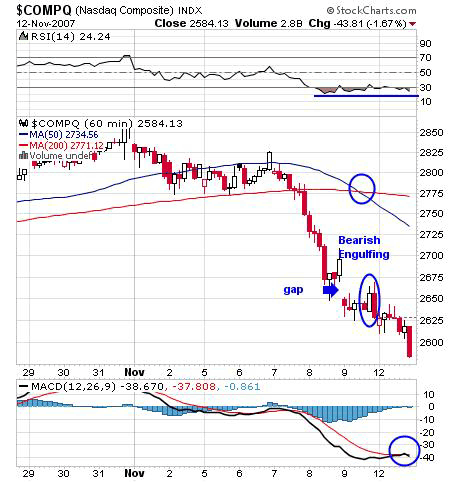
| The real mayhem in the NASDAQ Composite began at the lower range of consolidation or the 2775 levels. The index was trading in the 2775-2800 range for almost two to three days. As the trading range broke to the downside, $COMPQ lost around 100 points, moving lower to 2675 levels along with the relative strength index(RSI)(14) getting oversold at 20 levels. The next trading session on November 9 made a correction more serious by opening 25 points gap down. This session after trading in a narrow range of 2650-2625, gave another bearish indication in the latter half of the day. In Figure 1, you can see that a bearish engulfing pattern formed on November 9; the last-hour bearish candle has covered the previous bullish candle completely. |

|
| FIGURE 1: $COMPQ, HOURLY. The bearish engulfing signaled a bearish rally in the next intraday trading session. |
| Graphic provided by: StockCharts.com. |
| |
| The bearish engulfing is a bearish reversal pattern, showing a temporary change in uptrend. The effects of a bearish pattern on the hourly chart shown in Figure 1 were reflected immediately in the next trading session of November 12. In addition, the moving averages gave a bearish crossover, strengthening the downside rally. On November 12, $COMPQ traded 1.67% lower, while the RSI (14) continued to be oversold under the 30 level resistance. In addition, the MACD is highly negative at the -38 level. Therefore, the intraday trading chart has a bearish indication, showing that more downside is possible. However, the RSI (14) can remain oversold at the same level or move far below 20; some pullback can be expected. This pullback could actually happen, so traders should watch the RSI (14) moving above the oversold territory. |
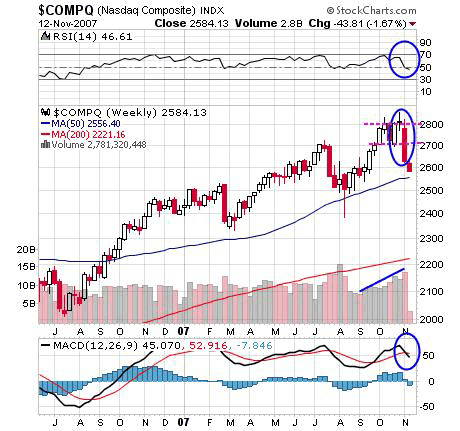
| Like the 60-minute chart, the weekly chart too has broken down from the bullish consolidation (Figure 2). The weekly chart was forming a bullish flag and pennant continuation pattern after rallying 200 points in the upside direction. This formation breaks out in a bullish direction, but the breakout here failed and $COMPQ slipped down from bullish formation. With this sudden unexpected breakdown, the RSI(14) has marginally moved below its bullish support of the 50 level. In addition, the MACD (12,26,9) is trying a bearish crossover in the positive territory of an indicator. This whole picture is with a reference to the flag & pennant formation, but if we observe carefully,one more bearish reversal pattern was being formed while consolidating. |

|
| FIGURE 2: $COMPOQ, WEEKLY. The flag & pennant pattern broke in the reverse direction unexpectedly, bringing in a panic situation. |
| Graphic provided by: StockCharts.com. |
| |
| Before the lower consolidation range of 2700 was violated by the previous weekly candle (Figure 2), the formation looked like an evening doji star. The evening doji star is a three-candle formation, a first bullish candle then a doji star, followed by a bearish candle that closes well within the body of the first bullish candle. Till the lower range was held, the formation in Figure 2 (see circle) looked like an evening doji star, indicating some downfall. So though the breaking down of the bullish flag & pennant was unexpected, the appearance of the evening doji star was a warning signal. The next support stands at the 2550 level, so if Asia moves moderately and domestic stability comes in, some bounceback rally can be expected. |
| Therefore, there were few of these bearish indications pointing towards the ongoing volatility in US financial markets. The correction is almost near the support areas, so there are no new shorts, but traders can wait for a confirming bounce from the support areas before opening a position. |
Active trader in the Indian stock markets since 2003 and a full-time writer. Trading is largely based upon technical analysis.
| Company: | Independent |
| Address: | C1/3 Parth Indraprasth Towers. Vastrapur |
| Ahmedabad, Guj 380015 | |
| E-mail address: | chaitalimohile@yahoo.co.in |
Traders' Resource Links | |
| Independent has not added any product or service information to TRADERS' RESOURCE. | |
Click here for more information about our publications!
Comments
Date: 11/13/07Rank: 2Comment:
Date: 11/14/07Rank: 5Comment:
Date: 11/27/07Rank: 5Comment:
Date: 11/27/07Rank: 5Comment: You people make me feel like, i am in school, teaching me ECONOMICS, making me to understand it more, oh i am bless.

Request Information From Our Sponsors
- StockCharts.com, Inc.
- Candle Patterns
- Candlestick Charting Explained
- Intermarket Technical Analysis
- John Murphy on Chart Analysis
- John Murphy's Chart Pattern Recognition
- John Murphy's Market Message
- MurphyExplainsMarketAnalysis-Intermarket Analysis
- MurphyExplainsMarketAnalysis-Visual Analysis
- StockCharts.com
- Technical Analysis of the Financial Markets
- The Visual Investor
- VectorVest, Inc.
- Executive Premier Workshop
- One-Day Options Course
- OptionsPro
- Retirement Income Workshop
- Sure-Fire Trading Systems (VectorVest, Inc.)
- Trading as a Business Workshop
- VectorVest 7 EOD
- VectorVest 7 RealTime/IntraDay
- VectorVest AutoTester
- VectorVest Educational Services
- VectorVest OnLine
- VectorVest Options Analyzer
- VectorVest ProGraphics v6.0
- VectorVest ProTrader 7
- VectorVest RealTime Derby Tool
- VectorVest Simulator
- VectorVest Variator
- VectorVest Watchdog
