HOT TOPICS LIST
- MACD
- Fibonacci
- RSI
- Gann
- ADXR
- Stochastics
- Volume
- Triangles
- Futures
- Cycles
- Volatility
- ZIGZAG
- MESA
- Retracement
- Aroon
INDICATORS LIST
LIST OF TOPICS
PRINT THIS ARTICLE
by Koos van der Merwe
Was last week the start of the meltdown?
Position: Sell
Koos van der Merwe
Has been a technical analyst since 1969, and has worked as a futures and options trader with First Financial Futures in Johannesburg, South Africa.
PRINT THIS ARTICLE
ELLIOTT WAVE
Tough Times Ahead For The Dow 30?
11/12/07 10:00:45 AMby Koos van der Merwe
Was last week the start of the meltdown?
Position: Sell
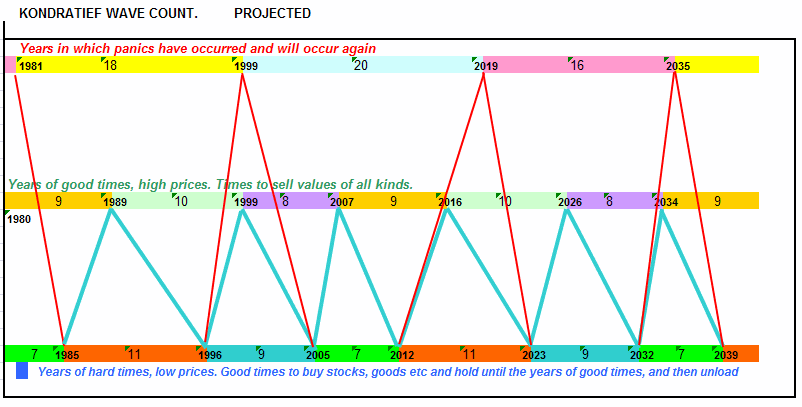
| The Kondatieff wave chart (Figure 1) suggests that the market's trend is down, from years of good times and high prices, time to sell value of all kinds, to years of hard times and low prices — a time to buy. The chart also suggests that the downtrend will last five years, until 2012. |

|
| FIGURE 1: KONDRATIEFF WAVE. The trend is down, according to the Kondratieff wave. |
| Graphic provided by: K vd Merwe. |
| |
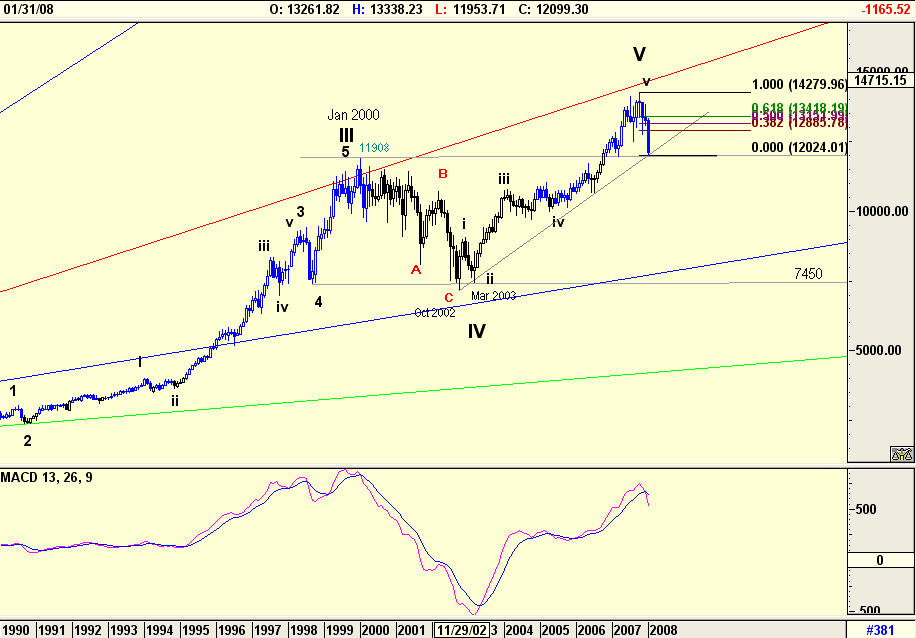
| So how accurate is the chart? Well, we have to simply look at the year on the chart, 1999, which forecast the 2000 meltdown. Of course, with CNBC announcers broadcasting that "things [as in the economy] are different this time" because of technology, no one accepted the K-wave forecast much to their regret, and those who did consulted psychologists to justify their selling decisions. The K-wave chart showed that the 1999–2005 meltdown would be huge and dramatic and it was, but the bottom, as we all know now, was in October 2002 with a double bottom in 2003, not 2005 as shown in the K-wave chart. Does this suggest that the meltdown to 2012 could end in 2010, and that it may not be that severe? To answer these questions, we look at Figure 2 and the Elliott wave count of a monthly chart of the Dow Jones Industrial Average (DJIA). |

|
| FIGURE 2: DJIA, MONTHLY. This chart shows the wave count. |
| Graphic provided by: AdvancedGET. |
| |
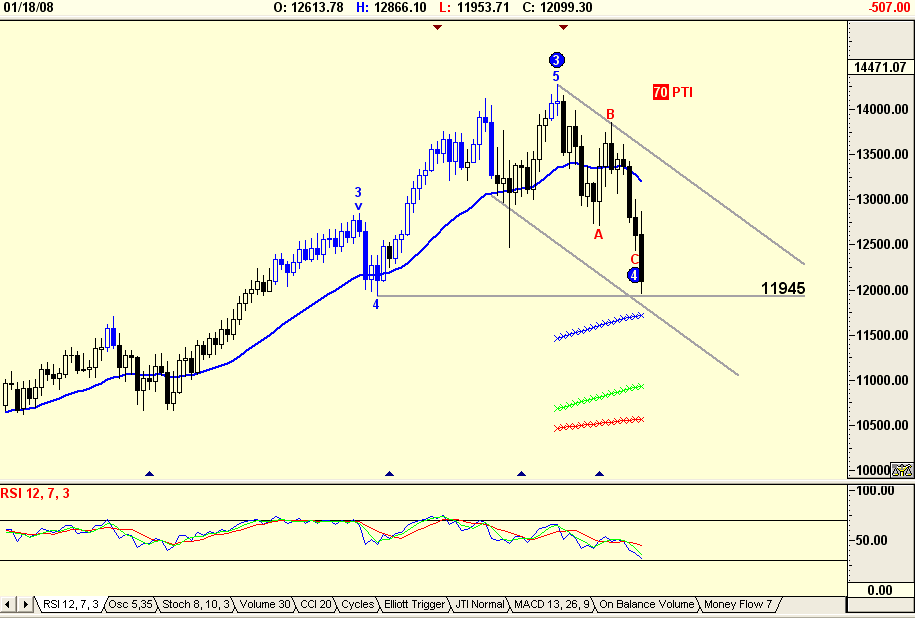
| Today, with hindsight, we all know that the present volatility in the market is caused by the subprime mortgage crises. With no one able to predict the final outcome, nor the recovery of financial institutions affected by this crises; with Ben Bernanke, chairman of the US Federal Reserve, talking in understandable language, the end is nowhere in sight. Figure 3 suggests that the expected A-B-C correction could finalize anywhere between 7467 and 11592, the fourth wave of lesser degree. Do note that the moving average convergence/divergence (MACD) indicator has NOT YET confirmed a sell signal, so the DJIA could see a retest of its high before a strong down move. |

|
| FIGURE 3: DJIA, DAILY. This daily chart shows indicators and the wave count. |
| Graphic provided by: AdvancedGET. |
| |
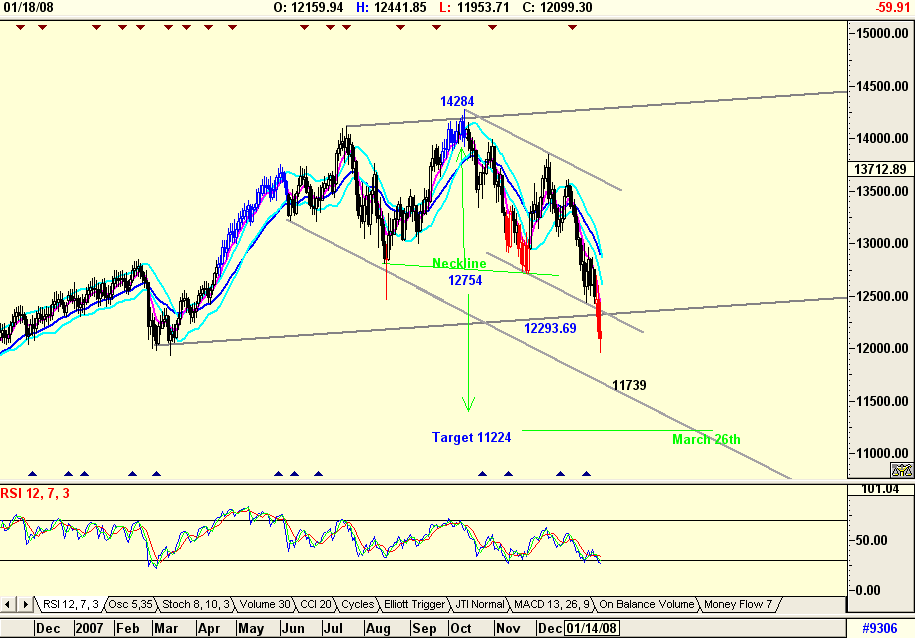
| Figure 3 is a daily chart of the DJIA. This shows the immediate Elliott wave count and suggests the following: a. The B-wave rose to the level of the Vth wave, a suggestion that the C-wave correction could be a flat — by this I mean not as drastic as C-waves usually are. In the chart I have shown the fourth wave of lesser degree as being between 11943 and 12854, however, as a flat the end of the C-wave should be closer to 12854 than 11943. b. C-waves can fall in an A-B-C pattern, or a 1-2-3-4-5 impulse wave count. I am suggesting the latter, but this need not necessarily be so. c. The relative strength index (RSI) is suggesting that an upward correction could happen in the weeks ahead. The MACD is however still suggesting weakness. d. Should the upward correction occur as suggested by the RSI, the DJIA should not move above 13344.45, the low of wave 1 of wave C. Should this happen, then it would mean that the correction down would be an A-B-C correction and not a five-wave impulse count as I have suggested. e. Finally, note that the low of wave A, at 12464.16 within the fourth wave of lesser degree, could act as a support level and a low for the correction. Do realize that the completion of this correction would only suggest the completion of wave A on Figure 2. |

|
| |
| That the subprime crisis is causing chaos within the market; that the US is slowly falling into a recession, although not confirmed by Ben Bernanke the Federal Reserve chairman, at his recent report to the US Senate, is without doubt. However, daily charts suggest that there should be a correction upward allowing investors time to offload before the final crunch into the years 2010–12, the years as forecast by the K-wave as the end of the recession. Tough times ahead without doubt. |
Has been a technical analyst since 1969, and has worked as a futures and options trader with First Financial Futures in Johannesburg, South Africa.
| Address: | 3256 West 24th Ave |
| Vancouver, BC | |
| Phone # for sales: | 6042634214 |
| E-mail address: | petroosp@gmail.com |
Click here for more information about our publications!
Comments
Date: 11/13/07Rank: 4Comment:
Date: 11/13/07Rank: 5Comment:

Request Information From Our Sponsors
- StockCharts.com, Inc.
- Candle Patterns
- Candlestick Charting Explained
- Intermarket Technical Analysis
- John Murphy on Chart Analysis
- John Murphy's Chart Pattern Recognition
- John Murphy's Market Message
- MurphyExplainsMarketAnalysis-Intermarket Analysis
- MurphyExplainsMarketAnalysis-Visual Analysis
- StockCharts.com
- Technical Analysis of the Financial Markets
- The Visual Investor
- VectorVest, Inc.
- Executive Premier Workshop
- One-Day Options Course
- OptionsPro
- Retirement Income Workshop
- Sure-Fire Trading Systems (VectorVest, Inc.)
- Trading as a Business Workshop
- VectorVest 7 EOD
- VectorVest 7 RealTime/IntraDay
- VectorVest AutoTester
- VectorVest Educational Services
- VectorVest OnLine
- VectorVest Options Analyzer
- VectorVest ProGraphics v6.0
- VectorVest ProTrader 7
- VectorVest RealTime Derby Tool
- VectorVest Simulator
- VectorVest Variator
- VectorVest Watchdog
