HOT TOPICS LIST
- MACD
- Fibonacci
- RSI
- Gann
- ADXR
- Stochastics
- Volume
- Triangles
- Futures
- Cycles
- Volatility
- ZIGZAG
- MESA
- Retracement
- Aroon
INDICATORS LIST
LIST OF TOPICS
PRINT THIS ARTICLE
by Paolo Pezzutti
News about technology orders from US business pushed prices to the downside the day after a new high was printed.
Position: N/A
Paolo Pezzutti
Author of the book "Trading the US Markets - A Comprehensive Guide to US Markets for International Traders and Investors" - Harriman House (July 2008)
PRINT THIS ARTICLE
TECHNICAL ANALYSIS
Cisco: Turtle Soup Plus One
11/12/07 12:16:30 PMby Paolo Pezzutti
News about technology orders from US business pushed prices to the downside the day after a new high was printed.
Position: N/A
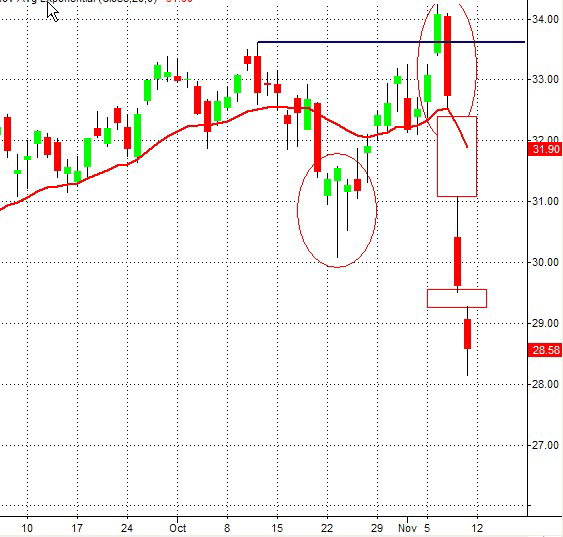
| Cisco stock (CSCO) during the past week lost more than 10% as the company's first-quarter results raised concerns about slowing technology orders from large US businesses. In particular, Cisco's chief executive, on a conference call, said that orders from US banks showed dramatic decreases in the last quarter. In addition, the outlook was not estimated too favorably. Cisco had already started a correction in October. As you can see in Figure 1, the hammer printed on October 23 provided a good support to push prices higher and print a new high on November 6. The closure above the previous high set the scene for a "turtle soup plus one pattern." The pattern was introduced by Linda Bradford Raschke and Laurence A. Connors in their book, Street Smarts: High Probability Short-Term Trading Strategies. The aim of the pattern is to profit from false breakouts. When the trend is strong, the reversal will not be long. However, sometimes reversals can be quite profitable. It is a swing trading pattern that works well in volatile markets. It benefits from the fact that many traders enter the day of the breakout on close and the next day they are trapped when prices reenter the previous day's trading range. The rule for short trades are: - The previous 20-day high has to be at least three days earlier. The close for the day must be at or above the previous 20-day high. - The entry-sell short-stop order is placed the next day at the earlier 20-day high. The opposite is true for buy trades. The pattern worked very well this time and the stock accelerated to the downside printing three consecutive negative closes characterized by two big gaps. The first gap can be classified as a breakaway gap. The second one could be a continuation gap, but this has to be verified in the next sessions. |

|
| FIGURE 1: CSCO, DAILY. The stock printed a Turtle Soup Plus One pattern. The day after printing a new high, prices plunged back into the trading range, accelerating to the downside. This short-term pattern has the advantage to have a very good risk/reward ratio and to provide a clear stop-loss level represented by the high of the top bar. |
| Graphic provided by: TradeStation. |
| |
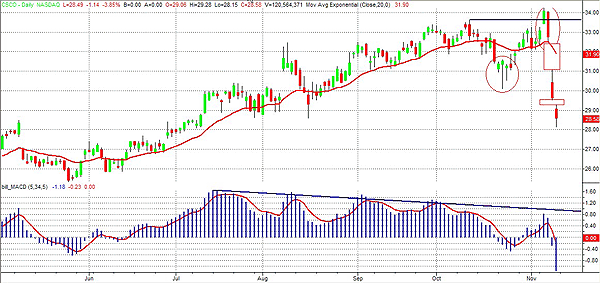
| In Figure 2 you can see that the stock during the past months had developed a nice uptrend. The moving average convergence/divergence (MACD) has printed four consecutive negative divergences before starting the down move in coincidence with the fifth one. This is a demonstration of the fact that trading based on signals provided exclusively by divergences in a strong trend can be quite painful. As you may know, the MACD calculates two exponential moving averages (EMAs) of specified lengths and the difference is then plotted. This value is also averaged and then plotted. |

|
| FIGURE 2: CSCO, DAILY. The MACD printed four consecutive negative divergences during the uptrend before correcting. |
| Graphic provided by: TradeStation. |
| |
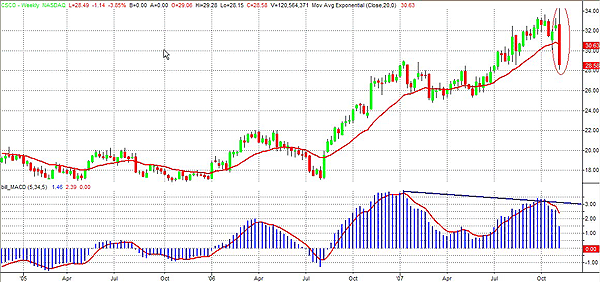
| In Figure 3, the weekly chart displays the uptrend started in August 2006 with prices that doubled in 15 months. In addition, in this time frame the MACD has developed a negative divergence. Last week, prices printed a wide-ranging bar to the downside. These bars have to be put in context because they cannot provide useful indications per se. However, the idea is that they are quite important, as they indicate the emotional participation of the public in the move. Normally, they are associated with high volume. In fact, Cisco during last week printed the highest volume since October 2002. They are useful as they indicate that prices should continue lower and their high provides a significant resistance level. Should prices negate the indication and break out the high of the bar, there would likely be an acceleration of the move to the upside. Sometimes, in strong uptrends this occurs with the development of what initially looks like a rebound. Bar after bar, prices slowly reach the high of the bar again to break out and explode to the upside. In other situations after a strong trend, these bars open long consolidation and sideways moves. |

|
| FIGURE 3: CSCO, WEEKLY. The stock doubled in about 15 months. A wide-ranging bar has now given the indication that the trend might be over. |
| Graphic provided by: TradeStation. |
| |
| In summary, this selloff is occurring after a strong and prolonged trend. It could open a period of weakness as the technical indications are not positive. In the short term, there could be trading opportunities should the stock move to the upside to attempt closing the gaps. Fading gaps provide a statistical edge, but it requires clearly identified and managed stop-losses. In addition, the risk/reward ratio must be well evaluated before opening a trade. |
Author of the book "Trading the US Markets - A Comprehensive Guide to US Markets for International Traders and Investors" - Harriman House (July 2008)
| Address: | VIA ROBERTO AGO 26 POSTAL CODE 00166 |
| Rome, ITALY | |
| Phone # for sales: | +393357540708 |
| E-mail address: | pezzutti.paolo@tiscali.it |
Click here for more information about our publications!
Comments
Date: 11/12/07Rank: 4Comment:
Date: 11/13/07Rank: 5Comment:

Request Information From Our Sponsors
- StockCharts.com, Inc.
- Candle Patterns
- Candlestick Charting Explained
- Intermarket Technical Analysis
- John Murphy on Chart Analysis
- John Murphy's Chart Pattern Recognition
- John Murphy's Market Message
- MurphyExplainsMarketAnalysis-Intermarket Analysis
- MurphyExplainsMarketAnalysis-Visual Analysis
- StockCharts.com
- Technical Analysis of the Financial Markets
- The Visual Investor
- VectorVest, Inc.
- Executive Premier Workshop
- One-Day Options Course
- OptionsPro
- Retirement Income Workshop
- Sure-Fire Trading Systems (VectorVest, Inc.)
- Trading as a Business Workshop
- VectorVest 7 EOD
- VectorVest 7 RealTime/IntraDay
- VectorVest AutoTester
- VectorVest Educational Services
- VectorVest OnLine
- VectorVest Options Analyzer
- VectorVest ProGraphics v6.0
- VectorVest ProTrader 7
- VectorVest RealTime Derby Tool
- VectorVest Simulator
- VectorVest Variator
- VectorVest Watchdog
