HOT TOPICS LIST
- MACD
- Fibonacci
- RSI
- Gann
- ADXR
- Stochastics
- Volume
- Triangles
- Futures
- Cycles
- Volatility
- ZIGZAG
- MESA
- Retracement
- Aroon
INDICATORS LIST
LIST OF TOPICS
PRINT THIS ARTICLE
by Chaitali Mohile
$DJUSCH is forming a continuation pattern at higher levels, so the index may move in a narrow range till the formation matures if lower support is held.
Position: N/A
Chaitali Mohile
Active trader in the Indian stock markets since 2003 and a full-time writer. Trading is largely based upon technical analysis.
PRINT THIS ARTICLE
TRIANGLES
DJ US Chemical Index May Move In Narrow Range
11/09/07 01:14:15 PMby Chaitali Mohile
$DJUSCH is forming a continuation pattern at higher levels, so the index may move in a narrow range till the formation matures if lower support is held.
Position: N/A
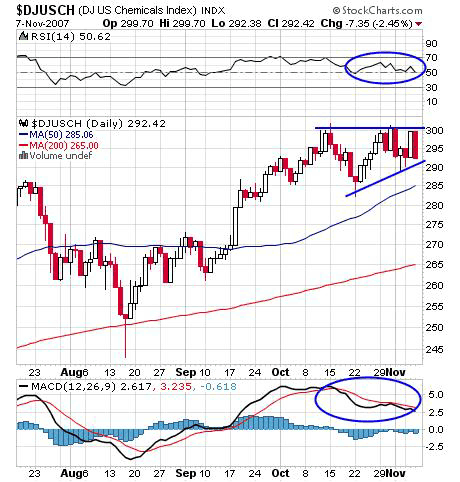
| Dow Jones Chemical Index ($DJUSCH) slipped to its lower support from the all-time high level of 300. The index formed a hammer at this support and rallied back to its previous high, further moving within a range of 10 points. As a result, an ascending triangle is forming with a buy line at the 300 level and a sell line moving upward from 285. This triangle is a continuation pattern at upper levels and hence a bullish formation. But the formation is yet to mature so the range may get narrower as the sellers' line moves closer to the buyers' line. The triangle may be completed on soft normal market notes, but the twist in the story is the current credit crisis tremor in the US markets. The sellers' line will act as a support system to continue this bullish continuation pattern. See Figure 1. |

|
| FIGURE 1: $DJUSCH, DAILY. Under smooth market conditions, the triangle on maturity would give an upside breakout with positive indicators support. |
| Graphic provided by: StockCharts.com. |
| |
| The indicators are equally bullish to anticipate the formation to complete successfully; in addition, the range is also broad. But as the pattern moves farther, the range will turn narrower, which might harm the bullish rally if the crisis continues. The relative strength index (RSI)(14) is at the 50 support level; a slip below this mark would gradually turn down the price movement, so market action from here should be watched carefully. In addition, the moving average convergence/divergence (MACD)(12,26,9) is below its trigger line in positive territory. So technically the chart is supporting the smooth upside breakout from an ascending triangle, but global weakness is back. The weakening dollar across Asia and now also against the euro are among a few reasons that has resulted in a financial crisis in the US economy. |
| The estimated level on the ascending triangle is measured, adding the height of the triangle to the breakout level. Those who are following this index can calculate the target on a confirmed breakout. The indicators are in an important support zone so traders can be on high alert. |

|
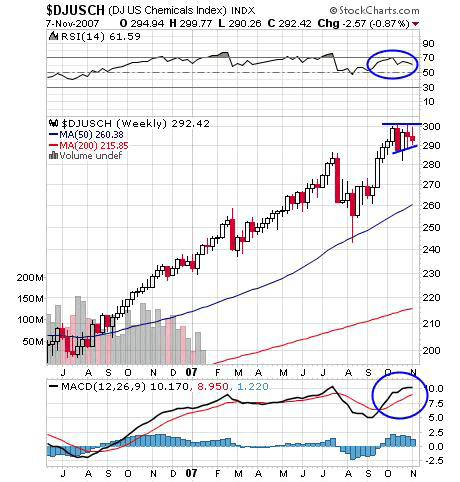
| FIGURE 2: $DJUSCH, WEEKLY. The flag & pennant is a bullish continuation pattern, and the index has formed the flag after a 40-point advance rally. The length of the flag pole (that is, the advance rally) is 40. |
| Graphic provided by: StockCharts.com. |
| |
| The weekly chart (Figure 2) shows yet another bullish continuation pattern. The chemical Index turned sideways on hitting the high at the 300. The 10-point range move formed a flag & pennant formation, which on breakout gives a new upside rally. During this consolidation, the RSI (14) has declined from 70 to 61 levels, yet the indicator is bullish till the golden support of 50 exists. The MACD (12,26,9) is equally strong and positive to carry the consolidation, provided the indicator maintains the same bullish positions. The target on the flag & pennant is calculated, measuring the height of flag pole (advance rally) and adding the same to the breakout level. |
| Both charts are equally bullish for a long trade after the confirmed breakout, but the current domestic and global situations worry me more. The only concern is the market's hip-hop need not spoil the party. The support seller's line of an ascending triangle should be watched carefully. |
Active trader in the Indian stock markets since 2003 and a full-time writer. Trading is largely based upon technical analysis.
| Company: | Independent |
| Address: | C1/3 Parth Indraprasth Towers. Vastrapur |
| Ahmedabad, Guj 380015 | |
| E-mail address: | chaitalimohile@yahoo.co.in |
Traders' Resource Links | |
| Independent has not added any product or service information to TRADERS' RESOURCE. | |
Click here for more information about our publications!
Comments

Request Information From Our Sponsors
- VectorVest, Inc.
- Executive Premier Workshop
- One-Day Options Course
- OptionsPro
- Retirement Income Workshop
- Sure-Fire Trading Systems (VectorVest, Inc.)
- Trading as a Business Workshop
- VectorVest 7 EOD
- VectorVest 7 RealTime/IntraDay
- VectorVest AutoTester
- VectorVest Educational Services
- VectorVest OnLine
- VectorVest Options Analyzer
- VectorVest ProGraphics v6.0
- VectorVest ProTrader 7
- VectorVest RealTime Derby Tool
- VectorVest Simulator
- VectorVest Variator
- VectorVest Watchdog
- StockCharts.com, Inc.
- Candle Patterns
- Candlestick Charting Explained
- Intermarket Technical Analysis
- John Murphy on Chart Analysis
- John Murphy's Chart Pattern Recognition
- John Murphy's Market Message
- MurphyExplainsMarketAnalysis-Intermarket Analysis
- MurphyExplainsMarketAnalysis-Visual Analysis
- StockCharts.com
- Technical Analysis of the Financial Markets
- The Visual Investor
