HOT TOPICS LIST
- MACD
- Fibonacci
- RSI
- Gann
- ADXR
- Stochastics
- Volume
- Triangles
- Futures
- Cycles
- Volatility
- ZIGZAG
- MESA
- Retracement
- Aroon
INDICATORS LIST
LIST OF TOPICS
PRINT THIS ARTICLE
by Chaitali Mohile
The Hang Seng Index has had a wild bull run in a short time period. The rally is now likely to enter dark clouds, resulting in a strong correction. The declining move has begun with a gap down on the index.
Position: N/A
Chaitali Mohile
Active trader in the Indian stock markets since 2003 and a full-time writer. Trading is largely based upon technical analysis.
PRINT THIS ARTICLE
BULL/BEAR MARKET
Hang Seng Likely To Face Turbulence
11/09/07 12:58:59 PMby Chaitali Mohile
The Hang Seng Index has had a wild bull run in a short time period. The rally is now likely to enter dark clouds, resulting in a strong correction. The declining move has begun with a gap down on the index.
Position: N/A
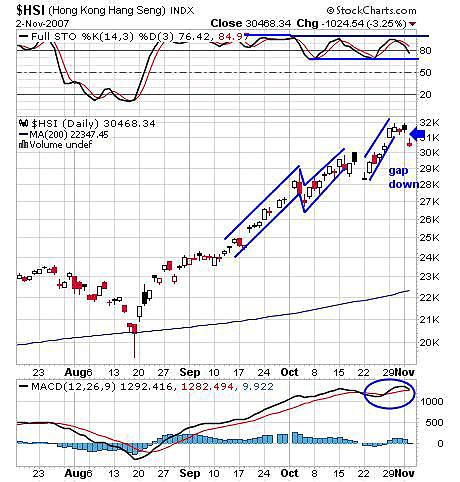
| The figures of the Hang Seng index charts have boosted since mid-September and reached the benchmark levels of 32000. The rally took less than two months to reach these new highs. The stochastic (14,3,3) was already overbought at the early stages of this bull ride. Even the moving average convergence/divergence (MACD) shifted to positive territory and thereon has remained highly positive, carrying the rally to new highs. The rally that geared up from the 24000 level had a stable upside journey apart from a single-day down gap in mid-October. The gap down recovered faster with the stochastic (14,3,3), moving back to the overbought area after a minor valley below 80. A similar situation has occurred once again on the same time frame. But this time, the correction seems more serious. |

|
| FIGURE 1: HANG SENG, DAILY. The Hang Seng has reached benchmark levels. |
| Graphic provided by: StockCharts.com. |
| |
| The new high at 32000 is left behind and with the gap down, the price traded below the day's high, finally closing near the intraday low. The red doji along with the gap down has brought in significant weakness that can lead to a further downfall. Looking at the speed of the upside rally, the correction would be equally wide in range, say 800-900 points. The speed of the bullish rally was much talked about and traders remained cautious throughout the move. With a gap down, the declining stochastic (14,3,3) may rest on the previous support level shown with the trendline on the chart. This action can further damage the index levels. The MACD also gives bearish indications. The picture on the daily chart has a bearish bias. See Figure 1. |

|
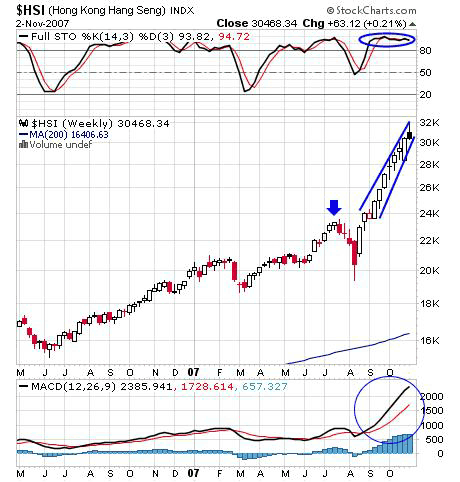
| FIGURE 2: HANG SENG, WEEKLY. The indicators on the weekly chart are heavily bullish, but how trustworthy are they? |
| Graphic provided by: StockCharts.com. |
| |
| The indicators on the weekly chart (Figure 2) are bullish, but how trustworthy are they? The stochastic (14,3,3) is very overbought at the 94 level. The indicator has remained overbought for almost two months and can remain there, but the momentum might slow down. The MACD (14,3,3) is in positive territory. Being a trader, I would stay cautious on further price action. Above all, the rising wedge is formed, which is a clear bearish indication that can result in a correction in the index. The rising wedge has a downside breakout so traders should be alert. |
| With such a scenario, the Hang Seng Index is now likely to tank, looking for lower support. The plunge in the Hang Seng may show its impact on other emerging markets as well. Those markets may see dull action during Hang Seng's down move. |
Active trader in the Indian stock markets since 2003 and a full-time writer. Trading is largely based upon technical analysis.
| Company: | Independent |
| Address: | C1/3 Parth Indraprasth Towers. Vastrapur |
| Ahmedabad, Guj 380015 | |
| E-mail address: | chaitalimohile@yahoo.co.in |
Traders' Resource Links | |
| Independent has not added any product or service information to TRADERS' RESOURCE. | |
Click here for more information about our publications!
Comments
Date: 11/12/07Rank: 5Comment:

Request Information From Our Sponsors
- StockCharts.com, Inc.
- Candle Patterns
- Candlestick Charting Explained
- Intermarket Technical Analysis
- John Murphy on Chart Analysis
- John Murphy's Chart Pattern Recognition
- John Murphy's Market Message
- MurphyExplainsMarketAnalysis-Intermarket Analysis
- MurphyExplainsMarketAnalysis-Visual Analysis
- StockCharts.com
- Technical Analysis of the Financial Markets
- The Visual Investor
- VectorVest, Inc.
- Executive Premier Workshop
- One-Day Options Course
- OptionsPro
- Retirement Income Workshop
- Sure-Fire Trading Systems (VectorVest, Inc.)
- Trading as a Business Workshop
- VectorVest 7 EOD
- VectorVest 7 RealTime/IntraDay
- VectorVest AutoTester
- VectorVest Educational Services
- VectorVest OnLine
- VectorVest Options Analyzer
- VectorVest ProGraphics v6.0
- VectorVest ProTrader 7
- VectorVest RealTime Derby Tool
- VectorVest Simulator
- VectorVest Variator
- VectorVest Watchdog
