HOT TOPICS LIST
- MACD
- Fibonacci
- RSI
- Gann
- ADXR
- Stochastics
- Volume
- Triangles
- Futures
- Cycles
- Volatility
- ZIGZAG
- MESA
- Retracement
- Aroon
INDICATORS LIST
LIST OF TOPICS
PRINT THIS ARTICLE
by Chaitali Mohile
After a long bullish rally, Gigamedia shows symptoms of a temporary halt in the directional move. The two bearish formations should be observed carefully.
Position: N/A
Chaitali Mohile
Active trader in the Indian stock markets since 2003 and a full-time writer. Trading is largely based upon technical analysis.
PRINT THIS ARTICLE
CANDLESTICK CHARTING
Gigamedia May See Bears Ride
11/07/07 02:31:01 PMby Chaitali Mohile
After a long bullish rally, Gigamedia shows symptoms of a temporary halt in the directional move. The two bearish formations should be observed carefully.
Position: N/A
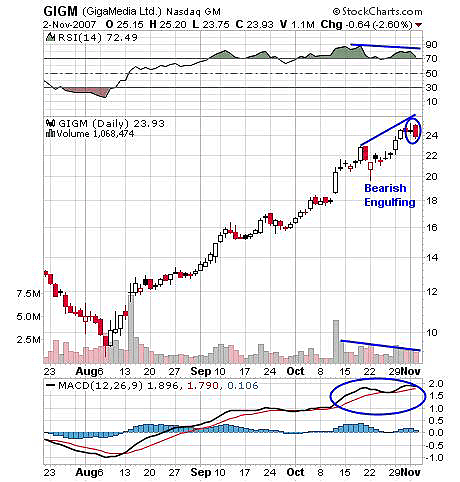
| Since early August 2007, Gigamedia (GIGM) has encouraged buying at healthy levels after minor sideways moves. The stock has gained almost 14 points since then, though the volume has remained a concern. Volume has been irregular, with sideways price action supporting the rally to reach new highs. Now, GIGM has formed a bearish engulfing pattern at this new high. Bearish engulfing is a bearish reversal pattern that can lead to intermediate change in the direction of a trend. The latest bearish candle has completely covered the previous bullish one. The bullish candle, however, is a form of doji and not a completely white candle, but since the candle occurred after a bullish rally, it too is considered bullish. See Figure 1. |

|
| FIGURE 1: GIGM, DAILY. The bearish engulfing and negative divergence can drag down Gigamedia, and make a change in the bullish rally temporarily. |
| Graphic provided by: StockCharts.com. |
| |
| The bearish engulfing formation suggested confirmation to save whipsaws. So we refer to two indicators, the relative strength index (RSI) (14) and the moving average convergence/divergence (MACD) (12,26,9). The RSI (14) has been in an overbought position for a much longer period. The highest overbought level was reached when the price tested the 22 level. Thereafter, the rally to 24 formed negative divergence on the RSI (14). This divergence is a bearish indicator and supports the breakout of the bearish candlestick formation. In addition, the MACD (12,26,9) histogram also has negative divergence. Traders should watch the MACD (12,26,9) movement; it may rest on the the trigger line or give a bearish crossover. |
| Therefore, most of the signals suggest a temporary bearish phase to begin soon. Traders may want to take their profits and stay on the sidelines till the bulls resume. |

|
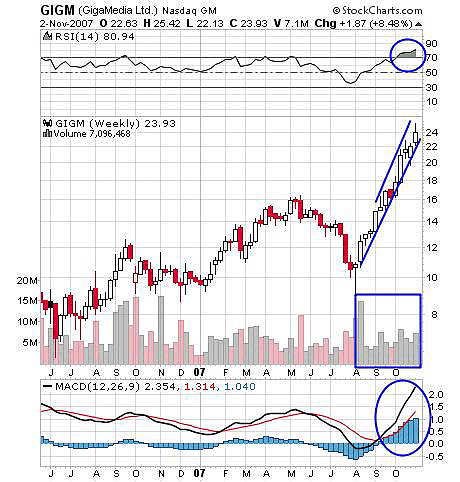
| FIGURE 2: GIGM, WEEKLY. The upside move with the base of overbought RSI (14) and vertical price action looks difficult to continue. |
| Graphic provided by: StockCharts.com. |
| |
| The weekly chart shows a long sideways movement(Figure 2). The stock has been struggling hard to break out of the resistance level of 14. But due to losing strength and volatile volume flow, the breakout failed. Eventually, as the RSI (14) moved above the 50 level and the MACD (12,26,9) turned positive with a bullish crossover, the resistance level was violated. The rally from 10 to 24 had irregular inflow of volume, which weakens the price action. The size of candles and the existence of upper and lower shadows in the majority of candles shows weakness in holding the highs and lows of the range. Even though the upside rally is not a rising wedge, the rally has a steep angle and the RSI (14) has moved into highly overbought territory. The MACD (12,26,9) is positive. The weekly chart is anything but bearish. The overbought RSI (14) in Figure 2 can cool off the price action and weaken the rally. |
| Though the weekly chart does not suggest any alarming trend change possibility, the bearish signals on the daily chart show that a correction of the upside movement could happen. |
Active trader in the Indian stock markets since 2003 and a full-time writer. Trading is largely based upon technical analysis.
| Company: | Independent |
| Address: | C1/3 Parth Indraprasth Towers. Vastrapur |
| Ahmedabad, Guj 380015 | |
| E-mail address: | chaitalimohile@yahoo.co.in |
Traders' Resource Links | |
| Independent has not added any product or service information to TRADERS' RESOURCE. | |
Click here for more information about our publications!
Comments
Date: 11/12/07Rank: 5Comment:

Request Information From Our Sponsors
- StockCharts.com, Inc.
- Candle Patterns
- Candlestick Charting Explained
- Intermarket Technical Analysis
- John Murphy on Chart Analysis
- John Murphy's Chart Pattern Recognition
- John Murphy's Market Message
- MurphyExplainsMarketAnalysis-Intermarket Analysis
- MurphyExplainsMarketAnalysis-Visual Analysis
- StockCharts.com
- Technical Analysis of the Financial Markets
- The Visual Investor
- VectorVest, Inc.
- Executive Premier Workshop
- One-Day Options Course
- OptionsPro
- Retirement Income Workshop
- Sure-Fire Trading Systems (VectorVest, Inc.)
- Trading as a Business Workshop
- VectorVest 7 EOD
- VectorVest 7 RealTime/IntraDay
- VectorVest AutoTester
- VectorVest Educational Services
- VectorVest OnLine
- VectorVest Options Analyzer
- VectorVest ProGraphics v6.0
- VectorVest ProTrader 7
- VectorVest RealTime Derby Tool
- VectorVest Simulator
- VectorVest Variator
- VectorVest Watchdog
