HOT TOPICS LIST
- MACD
- Fibonacci
- RSI
- Gann
- ADXR
- Stochastics
- Volume
- Triangles
- Futures
- Cycles
- Volatility
- ZIGZAG
- MESA
- Retracement
- Aroon
INDICATORS LIST
LIST OF TOPICS
PRINT THIS ARTICLE
by Paolo Pezzutti
This relatively uncommon pattern occurs in a high-volatility environment.
Position: N/A
Paolo Pezzutti
Author of the book "Trading the US Markets - A Comprehensive Guide to US Markets for International Traders and Investors" - Harriman House (July 2008)
PRINT THIS ARTICLE
BROADENING FORMATION
Goldman Sachs Develops A Broadening Formation
11/05/07 09:29:11 AMby Paolo Pezzutti
This relatively uncommon pattern occurs in a high-volatility environment.
Position: N/A
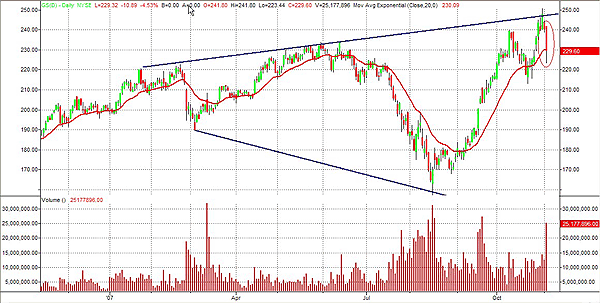
| On November 2, Goldman Sachs (GS) denied speculations that the biggest US brokerage by market capitalization could announce billions of dollars in writedowns. Nonetheless, prices plunged more than 4.5%. In the wake of Merrill Lynch's huge writedown the week before, traders are wondering whether GS could be forced to make a similar move. The market has been shaken by losses in the financial sector following the credit crisis that reached its peak last summer. There is still uncertainty about the exact dimension of losses. The Merril Lynch case raised again the fear among investors that the worst of the crisis has still to be seen. Last month GS reported a 79% rise in third-quarter profit. In Figure 1, you can see that since last August's low, shares have printed an impressive run of more than 50% in two and a half months. |

|
| FIGURE 1: GOLDMAN SACHS, DAILY. GS has developed a broadening formation since the start of 2007. The formation is characterized by high volatility and high volume with the public emotional participation. |
| Graphic provided by: TradeStation. |
| |
| From the technical perspective, the result of the increased volatility both to the downside and the upside has been the development of a broadening formation. This pattern is a variation of a triangle and it is not frequent. While triangles are characterized by converging trendlines, the broadening formation has diverging trendlines. The broadening formation is characterized by increasingly widening price swings and increasing volatility. Volume usually expands along with the wider price swings and the public emotional participation. Prices touch each trendline at least twice and print higher highs and lower lows. The breakout of this pattern normally develops high volatility. The public indecision and quick change of attitude expressed during the development of the formation finally explodes at the same time in a directional and volatile move. Trying to determine the direction of a breakout is difficult. Partial rises or partial declines can help. You have a partial rise when the price leaves the bottom trendline and moves higher but fails to touch or come close to the top trendline before turning away. Partial declines, however, are the opposite. |
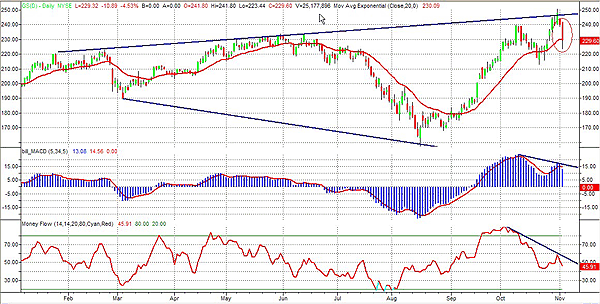
| GS has been developing a broadening formation since the beginning of 2007. So far, the lower trendline has been touched twice, while the higher trendline has been tested already three times. The top was printed on October 31. With the new high, in Figure 2 you can see that both the moving average convergence/divergence (MACD) and the money flow indicators have displayed a negative divergence. The use of these indicators through the analysis of positive and negative divergences can be useful. On November 2, prices printed a wide-ranging bar to the downside. The high of this bar represents a significant resistance to the upside and it is characterized by high volume. To the downside, there is room for a short-term movement at least to retest the $219 low of October 22. |

|
| FIGURE 2: GOLDMAN SACHS, DAILY. The MACD and the money flow display negative divergences and the possibility of weakness ahead. |
| Graphic provided by: TradeStation. |
| |
| There are different ways to trade this broadening formation from here. You can enter a short position as prices are close to the resistance. Risk is high, but the reward would be good and you could try and enter in quiet times during a rebound. The stop is clearly identified and its level is at about the high of the Friday, November 2nd down bar. Should the scenario to the downside be negated, you could open a long position either at the breakout or after a pullback (if it would ever occur) in a likely high-volatility environment. |
Author of the book "Trading the US Markets - A Comprehensive Guide to US Markets for International Traders and Investors" - Harriman House (July 2008)
| Address: | VIA ROBERTO AGO 26 POSTAL CODE 00166 |
| Rome, ITALY | |
| Phone # for sales: | +393357540708 |
| E-mail address: | pezzutti.paolo@tiscali.it |
Click here for more information about our publications!
PRINT THIS ARTICLE

Request Information From Our Sponsors
- StockCharts.com, Inc.
- Candle Patterns
- Candlestick Charting Explained
- Intermarket Technical Analysis
- John Murphy on Chart Analysis
- John Murphy's Chart Pattern Recognition
- John Murphy's Market Message
- MurphyExplainsMarketAnalysis-Intermarket Analysis
- MurphyExplainsMarketAnalysis-Visual Analysis
- StockCharts.com
- Technical Analysis of the Financial Markets
- The Visual Investor
- VectorVest, Inc.
- Executive Premier Workshop
- One-Day Options Course
- OptionsPro
- Retirement Income Workshop
- Sure-Fire Trading Systems (VectorVest, Inc.)
- Trading as a Business Workshop
- VectorVest 7 EOD
- VectorVest 7 RealTime/IntraDay
- VectorVest AutoTester
- VectorVest Educational Services
- VectorVest OnLine
- VectorVest Options Analyzer
- VectorVest ProGraphics v6.0
- VectorVest ProTrader 7
- VectorVest RealTime Derby Tool
- VectorVest Simulator
- VectorVest Variator
- VectorVest Watchdog
