HOT TOPICS LIST
- MACD
- Fibonacci
- RSI
- Gann
- ADXR
- Stochastics
- Volume
- Triangles
- Futures
- Cycles
- Volatility
- ZIGZAG
- MESA
- Retracement
- Aroon
INDICATORS LIST
LIST OF TOPICS
PRINT THIS ARTICLE
by Sean Moore
With a breakout above its long-term downtrend in early January, Kmart has been on the rise, with its stock price gaining nearly 65%.
Position: Buy
Sean Moore
Traders.com Staff Writer.
PRINT THIS ARTICLE
BREAKOUTS
Kmart Breaking the Trend
02/05/01 03:04:27 PMby Sean Moore
With a breakout above its long-term downtrend in early January, Kmart has been on the rise, with its stock price gaining nearly 65%.
Position: Buy
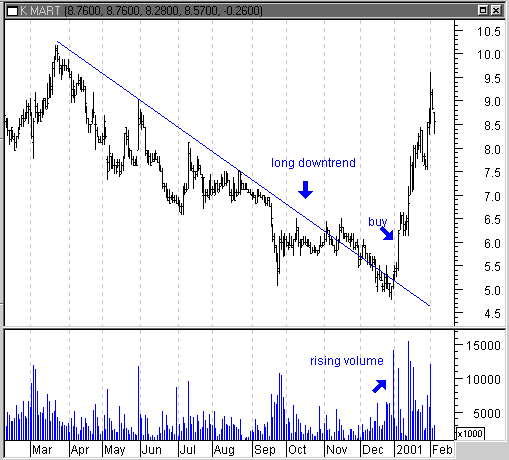
| Few stocks performed as well as that of the Kmart Corporation [KM] during January 2001. The stock rose nearly 65%, making a significant upswing from a long, steady downtrend. Kmart has broken into territory that it hasn't seen in quite some time, a welcome sign after nearly two years of decline. After spending two months moving sideways around the $6 level, Kmart's stock slipped to below $5 during December 2000. With woeful holiday sales, it seemed the retail sector could be in for another tough year. During the last few trading days in 2000 Kmart regained a little ground, bouncing up to $5.30 with relatively high volume. This was a positive sign, especially after three months of fairly flat volume. |
| On January 4, 2001, Kmart's stock rose approximately 15%, with a significant breakout above it's long-term downward trend (see Figure 1). This provided an excellent buying opportunity, especially considering the high volume. The stock has been in a rapid upswing ever since, breaking through several levels of resistance along the way. |

|
| Figure 1: Kmart made a significant move above its long-term downtrend in early January 2001 |
| Graphic provided by: MetaStock. |
| |
| This is an excellent example of a strong breakout above an established long-term trend. The stock maintained its upward movement throughout January and has been able to establish a new upward trend. The breakout is significant given the length the downtrend. The downtrend started in 1999, when Kmart was trading at $18. Identifying these long trends, whether they're increasing or decreasing, and looking for significant breakouts above or below the trends can provide some excellent opportunities for profit! |
Traders.com Staff Writer.
| Title: | Project Engineer |
| Company: | Technical Analysis, Inc. |
| Address: | 4757 California Ave. SW |
| Seattle, WA 98116 | |
| Phone # for sales: | 206 938 0570 |
| Fax: | 206 938 1307 |
| Website: | Traders.com |
| E-mail address: | smoore@traders.com |
Traders' Resource Links | |
| Charting the Stock Market: The Wyckoff Method -- Books | |
| Working-Money.com -- Online Trading Services | |
| Traders.com Advantage -- Online Trading Services | |
| Technical Analysis of Stocks & Commodities -- Publications and Newsletters | |
| Working Money, at Working-Money.com -- Publications and Newsletters | |
| Traders.com Advantage -- Publications and Newsletters | |
| Professional Traders Starter Kit -- Software | |
Click here for more information about our publications!
Comments

Request Information From Our Sponsors
- StockCharts.com, Inc.
- Candle Patterns
- Candlestick Charting Explained
- Intermarket Technical Analysis
- John Murphy on Chart Analysis
- John Murphy's Chart Pattern Recognition
- John Murphy's Market Message
- MurphyExplainsMarketAnalysis-Intermarket Analysis
- MurphyExplainsMarketAnalysis-Visual Analysis
- StockCharts.com
- Technical Analysis of the Financial Markets
- The Visual Investor
- VectorVest, Inc.
- Executive Premier Workshop
- One-Day Options Course
- OptionsPro
- Retirement Income Workshop
- Sure-Fire Trading Systems (VectorVest, Inc.)
- Trading as a Business Workshop
- VectorVest 7 EOD
- VectorVest 7 RealTime/IntraDay
- VectorVest AutoTester
- VectorVest Educational Services
- VectorVest OnLine
- VectorVest Options Analyzer
- VectorVest ProGraphics v6.0
- VectorVest ProTrader 7
- VectorVest RealTime Derby Tool
- VectorVest Simulator
- VectorVest Variator
- VectorVest Watchdog
