HOT TOPICS LIST
- MACD
- Fibonacci
- RSI
- Gann
- ADXR
- Stochastics
- Volume
- Triangles
- Futures
- Cycles
- Volatility
- ZIGZAG
- MESA
- Retracement
- Aroon
INDICATORS LIST
LIST OF TOPICS
PRINT THIS ARTICLE
by Gary Grosschadl
Atlanta-based Suntrust Banks (with assets of $180 billion), one of the nation's largest and strongest financial holding companies, is testing support.
Position: Hold
Gary Grosschadl
Independent Canadian equities trader and technical analyst based in Peterborough
Ontario, Canada.
PRINT THIS ARTICLE
ANDREWS PITCH-FORK
Suntrust Banks Caught In A Bearish Pattern
11/05/07 09:01:55 AMby Gary Grosschadl
Atlanta-based Suntrust Banks (with assets of $180 billion), one of the nation's largest and strongest financial holding companies, is testing support.
Position: Hold
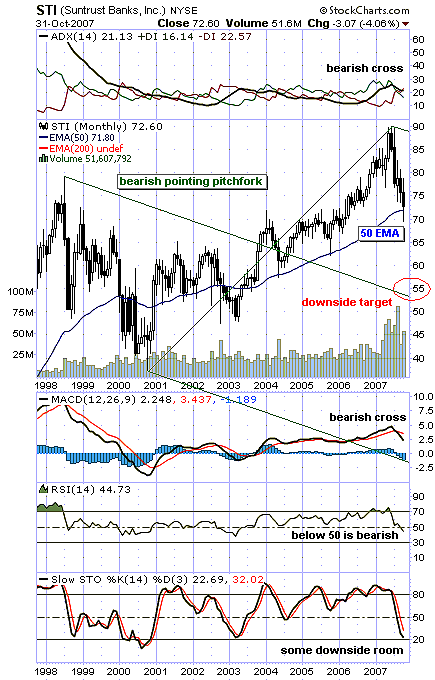
| Figure 1, a long-term monthly chart, shows this financial giant enjoying a doubling in stock price since 2000. Along the way, it eventually found good support from its 50-period exponential moving average (EMA) starting mid-2003. Currently, it is testing that mark again, only the third time since 2004. |
| A pitchfork is plotted on this chart using three turning points (the top in 1998, the low of 2001, and the 2007 peak). The parallel lines reflect a bearish pointing pitchfork with a median line target near $55. A move from either pitchfork extreme (upper median line or lower median line) tends to move to the center median line. On a rarer occasion it can swing all the way to the opposite extreme, but usually it's the center line. In this case, the downtrend is intact as long as the upper median line is not violated with a close above it (indicating a change in trend and a new pitchfork can then be drawn). |

|
| FIGURE 1: SUNTRUST BANKS, MONTHLY. This pitchfork chart suggests a bearish trend may be in effect. |
| Graphic provided by: StockCharts.com. |
| |
| The displayed indicators have a bearish look. The directional moving indicators (DIs) above the chart indicate a bearish trend change as they have recently crossed over. With the red line (-DI) above the green line (+DI), the bears have control. Trend strength above 20 on the black ADX line (the average directional movement index) shows trend strength growing. Current ADX is 21.3. Some traders prefer an ADX value above 25 before declaring good trend strength. The moving average convergence/divergence (MACD) shows a bearish cross, while the relative strength index (RSI) shows a bearish move below the often-key 50 level. The stochastic indicator is more hopeful in that it shows the downleg is "long in the tooth," meaning a stochastic upleg may not be far off. |
| If the 50-day EMA fails to hold support, a move toward the center median line is likely. This does not necessarily mean it will reach that mark on this downleg, as this may transpire at a later date. On the other hand, if support does hold, then the previous high could be challenged again or the upper median line close to it. At any rate, should the stock drift between the tines of the fork, the overall trend is down. |
Independent Canadian equities trader and technical analyst based in Peterborough
Ontario, Canada.
| Website: | www.whatsonsale.ca/financial.html |
| E-mail address: | gwg7@sympatico.ca |
Click here for more information about our publications!
PRINT THIS ARTICLE

Request Information From Our Sponsors
- StockCharts.com, Inc.
- Candle Patterns
- Candlestick Charting Explained
- Intermarket Technical Analysis
- John Murphy on Chart Analysis
- John Murphy's Chart Pattern Recognition
- John Murphy's Market Message
- MurphyExplainsMarketAnalysis-Intermarket Analysis
- MurphyExplainsMarketAnalysis-Visual Analysis
- StockCharts.com
- Technical Analysis of the Financial Markets
- The Visual Investor
- VectorVest, Inc.
- Executive Premier Workshop
- One-Day Options Course
- OptionsPro
- Retirement Income Workshop
- Sure-Fire Trading Systems (VectorVest, Inc.)
- Trading as a Business Workshop
- VectorVest 7 EOD
- VectorVest 7 RealTime/IntraDay
- VectorVest AutoTester
- VectorVest Educational Services
- VectorVest OnLine
- VectorVest Options Analyzer
- VectorVest ProGraphics v6.0
- VectorVest ProTrader 7
- VectorVest RealTime Derby Tool
- VectorVest Simulator
- VectorVest Variator
- VectorVest Watchdog
