HOT TOPICS LIST
- MACD
- Fibonacci
- RSI
- Gann
- ADXR
- Stochastics
- Volume
- Triangles
- Futures
- Cycles
- Volatility
- ZIGZAG
- MESA
- Retracement
- Aroon
INDICATORS LIST
LIST OF TOPICS
PRINT THIS ARTICLE
by Koos van der Merwe
An Internet service provider.
Position: Accumulate
Koos van der Merwe
Has been a technical analyst since 1969, and has worked as a futures and options trader with First Financial Futures in Johannesburg, South Africa.
PRINT THIS ARTICLE
HEAD & SHOULDERS
Is This A Reverse Head And Shoulders Buildup For Earthlink?
11/02/07 01:06:41 PMby Koos van der Merwe
An Internet service provider.
Position: Accumulate
| High-speed Internet access has become a necessary tool in the world today. Earthlink (ELNK) is one company among many that supplies that access, but what makes Earthlink different? Why are investors starting to take interest in the company's stock price again, especially in view of a possible recession in the US? |

|
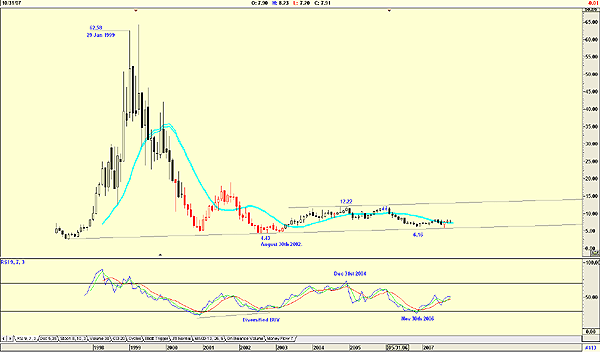
| FIGURE 1: EARTHLINK, MONTHLY. Here, ELNK shows past buy and sell signals. |
| Graphic provided by: AdvancedGET. |
| |
| Looking at a monthly chart (Figure 1), we can see how the stock price with the bubble burst at the turn of the century. The stock price reached a high of $62.58 in January 1999, then fell to a low of $4.43 by August 30, 2002. From that day the stock has traded in a very defined range with a high of $12.22. The chart also shows that the relative strength index (RSI) -- and here I use a nine-period RSI -- gave a buy signal (diversified) in August, and buyers at that price would have seen a 300%-odd profit before it gave a sell signal on December 31, 2004, at $12.22. On November 30, 2006, the RSI suggested a buy signal when the price was $6.16. |

|
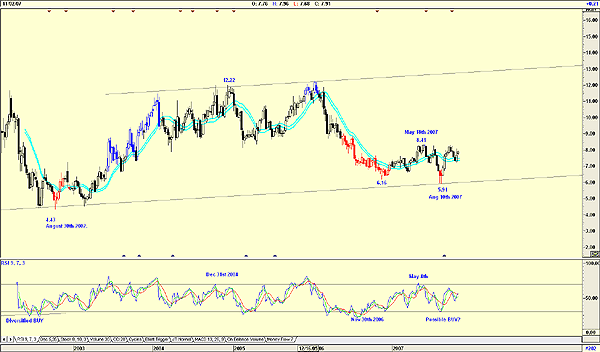
| FIGURE 2: EARTHLINK, WEEKLY. This chart shows how the indicator confirmed the possible buy signal of August 10. |
| Graphic provided by: AdvancedGET. |
| |
| A look at the weekly chart (Figure 2) shows how the price rose to $8.41 by May 18, 2007, but then fell back to the support line at $5.91, reacting to the RSI sell signal of May 18. The blue lines on the chart are the JM internal moving average channel. This is a simple 15-period moving average offset by 2% on either side. In penetrating the upper channel line, a buy signal is given, and a move below the lower channel line suggests a sell signal. The indicator is very successful for the more conservative investor. The chart shows how the indicator confirmed the possible buy of August 10. The stock price then fell, tested the lower band line, then continued moving up. |

|
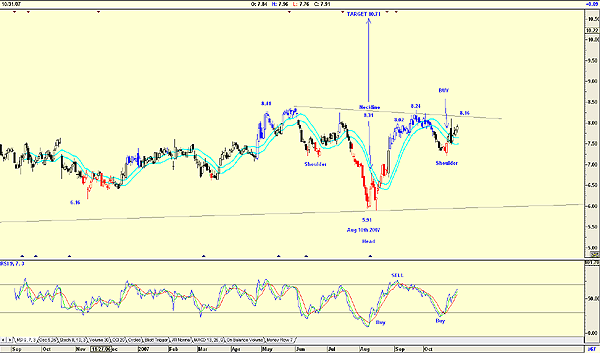
| FIGURE 3: EARTHLINK, DAILY. Here, ELNK shows the inverse head & shoulder pattern. |
| Graphic provided by: AdvancedGET. |
| |
| A daily chart shows the RSI confirming the buy signal of August 10, but soon gave a sell signal at $8.02 (Figure 3). The price rose to $8.24 before falling into what is becoming an inverse head & shoulders pattern. This suggests a target of $10.71, should the price break above the neckline at $8.16. Note the JM internal band lines. |
| ELNK has made my watchlist. Following the internal JM band lines, I would be a buyer. Should the price rise above the neckline of $8.16, I would then confirm the buy and confirm the target of $10.71. |
Has been a technical analyst since 1969, and has worked as a futures and options trader with First Financial Futures in Johannesburg, South Africa.
| Address: | 3256 West 24th Ave |
| Vancouver, BC | |
| Phone # for sales: | 6042634214 |
| E-mail address: | petroosp@gmail.com |
Click here for more information about our publications!
PRINT THIS ARTICLE

Request Information From Our Sponsors
- VectorVest, Inc.
- Executive Premier Workshop
- One-Day Options Course
- OptionsPro
- Retirement Income Workshop
- Sure-Fire Trading Systems (VectorVest, Inc.)
- Trading as a Business Workshop
- VectorVest 7 EOD
- VectorVest 7 RealTime/IntraDay
- VectorVest AutoTester
- VectorVest Educational Services
- VectorVest OnLine
- VectorVest Options Analyzer
- VectorVest ProGraphics v6.0
- VectorVest ProTrader 7
- VectorVest RealTime Derby Tool
- VectorVest Simulator
- VectorVest Variator
- VectorVest Watchdog
- StockCharts.com, Inc.
- Candle Patterns
- Candlestick Charting Explained
- Intermarket Technical Analysis
- John Murphy on Chart Analysis
- John Murphy's Chart Pattern Recognition
- John Murphy's Market Message
- MurphyExplainsMarketAnalysis-Intermarket Analysis
- MurphyExplainsMarketAnalysis-Visual Analysis
- StockCharts.com
- Technical Analysis of the Financial Markets
- The Visual Investor
