HOT TOPICS LIST
- MACD
- Fibonacci
- RSI
- Gann
- ADXR
- Stochastics
- Volume
- Triangles
- Futures
- Cycles
- Volatility
- ZIGZAG
- MESA
- Retracement
- Aroon
INDICATORS LIST
LIST OF TOPICS
PRINT THIS ARTICLE
by Gary Grosschadl
This chart of light crude oil suggests "close but no cigar" for $100 per barrel of oil price.
Position: Sell
Gary Grosschadl
Independent Canadian equities trader and technical analyst based in Peterborough
Ontario, Canada.
PRINT THIS ARTICLE
ANDREWS PITCH-FORK
$100 Oil?
11/02/07 11:29:12 AMby Gary Grosschadl
This chart of light crude oil suggests "close but no cigar" for $100 per barrel of oil price.
Position: Sell
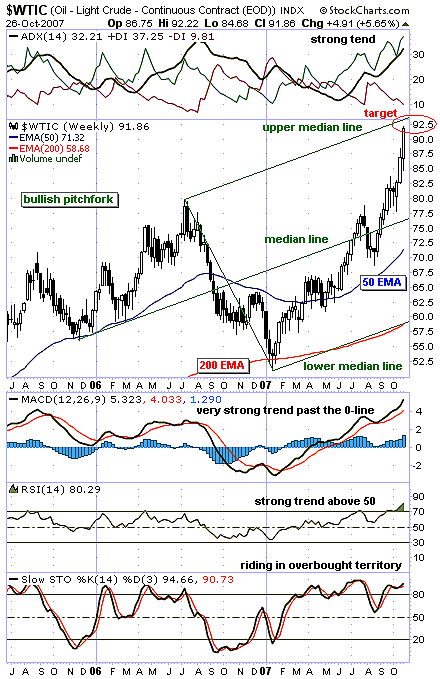
| It's hard to believe the prices of oil and gold these days. To help determine how much farther oil prices might climb, I drew a pitchfork chart (Figure 1). This is another way of showing support and resistance lines. This is an interesting case, as it is rare to see a "super bull move" like this on a pitchfork chart. This is where a move off the lower median line makes its way toward the upper median line. More often than not, the move usually stops or is repelled at the median (center) line. |
| I expect this move to top out very near this upper median line — say, close to $93, after which a corrective move can be surmised down to the center median line near the current level of $77. This move could also come lower to test the 50-period exponential moving average (EMA), currently at $71.32. Beyond that, the big picture is that as far as this pitchfork chart is concerned, the uptrend stays intact as long as the lower median line is not violated with a close below it, currently near $60. That is fine for long-term investors, but traders will likely take profits if not completely reverse course and possibly short this high-flying market. |

|
| FIGURE 1: $WTIC, WEEKLY. This chart suggests this monster move for oil may finally be topping out. |
| Graphic provided by: StockCharts.com. |
| |
| As expected, the displayed indicators reflect a very strong trend. The average directional movement index (ADX) is sloping upward well past the 20 level, the MACD (moving average convergence/divergence) shows strength well past the zero-line, and the relative strength index (RSI) showing similar strength above its 50 level. However, cautionary signals are surmised from toppy levels above 70 on the RSI and the stochastic oscillator is in overbought levels above 80. In a strong trending market the stochastic oscillator can "stick high" for an extended period. |
| In summary, I believe this move is topping out and a corrective down leg will likely ensue with support targets of the median line near $77 and the 50-day EMA currently $71. |
Independent Canadian equities trader and technical analyst based in Peterborough
Ontario, Canada.
| Website: | www.whatsonsale.ca/financial.html |
| E-mail address: | gwg7@sympatico.ca |
Click here for more information about our publications!
Comments
Date: 11/05/07Rank: 5Comment:

Request Information From Our Sponsors
- StockCharts.com, Inc.
- Candle Patterns
- Candlestick Charting Explained
- Intermarket Technical Analysis
- John Murphy on Chart Analysis
- John Murphy's Chart Pattern Recognition
- John Murphy's Market Message
- MurphyExplainsMarketAnalysis-Intermarket Analysis
- MurphyExplainsMarketAnalysis-Visual Analysis
- StockCharts.com
- Technical Analysis of the Financial Markets
- The Visual Investor
- VectorVest, Inc.
- Executive Premier Workshop
- One-Day Options Course
- OptionsPro
- Retirement Income Workshop
- Sure-Fire Trading Systems (VectorVest, Inc.)
- Trading as a Business Workshop
- VectorVest 7 EOD
- VectorVest 7 RealTime/IntraDay
- VectorVest AutoTester
- VectorVest Educational Services
- VectorVest OnLine
- VectorVest Options Analyzer
- VectorVest ProGraphics v6.0
- VectorVest ProTrader 7
- VectorVest RealTime Derby Tool
- VectorVest Simulator
- VectorVest Variator
- VectorVest Watchdog
