HOT TOPICS LIST
- MACD
- Fibonacci
- RSI
- Gann
- ADXR
- Stochastics
- Volume
- Triangles
- Futures
- Cycles
- Volatility
- ZIGZAG
- MESA
- Retracement
- Aroon
INDICATORS LIST
LIST OF TOPICS
PRINT THIS ARTICLE
by Koos van der Merwe
This tech firm announced another strong quarter.
Position: Accumulate
Koos van der Merwe
Has been a technical analyst since 1969, and has worked as a futures and options trader with First Financial Futures in Johannesburg, South Africa.
PRINT THIS ARTICLE
ELLIOTT WAVE
Sierra Wireless Beats Estimates
10/29/07 02:28:10 PMby Koos van der Merwe
This tech firm announced another strong quarter.
Position: Accumulate
| Sierra Wireless reported third-quarter revenues of US$111.5 million, ahead of the estimate of most fundamentalists. The key driver was a strong demand for the company's USB modems, particularily at Sprint and AT&T. The acquisition of AirLink contributed a full US$9.5 million with a gross margin of 53.2%. Impressive, and if you are a fundamentalist, you would project fourth-quarter earnings as extremely positive. It would do well to consider buying Sierra Wireless, and place a target of $32. Now, do remember that most fundamentalists regard technical analysis as witchcraft, but have a look at Figure 1, then remember that intuition should not be ignored. |

|
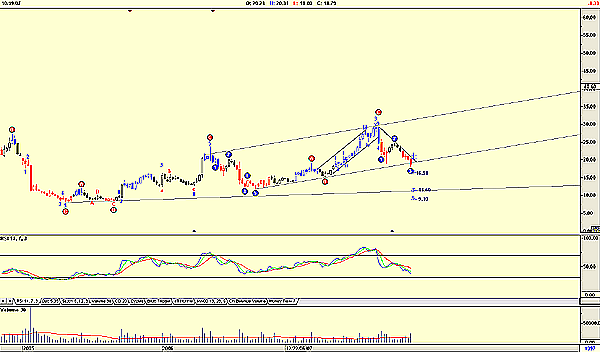
| FIGURE 1: SIERRA WIRELESS, WEEKLY. This chart of SW shows a wave count of Advanced GET. |
| Graphic provided by: AdvancedGET. |
| |
| However, the weekly chart (Figure 1) does not look that good. This is because the price has broken below a support level, and with a downtrending relative strength index (RSI), it is suggesting an Elliott wave target of 16.51, a wave 3 completion, or 11.60, on the long-term support line. The RSI is suggesting the latter. The increase in volume as the price fell confirms this. |

|
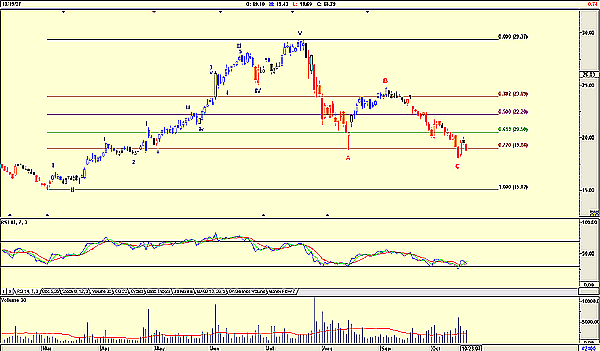
| FIGURE 2: SIERRA WIRELESS, DAILY. This chart of SW suggests that the stock could be bought at present levels. |
| Graphic provided by: AdvancedGET. |
| |
| A daily chart, on the other hand (and please don't believe that it is only economists who have two hands), suggests that the price could truly rise. The only problem with Figure 2 is that the Elliott wave count looks wrong. A C-wave should end in that area of the fourth wave of lesser degree. This C-wave appears to be ending in the area, of a subwave wave 1 and 2. |

|
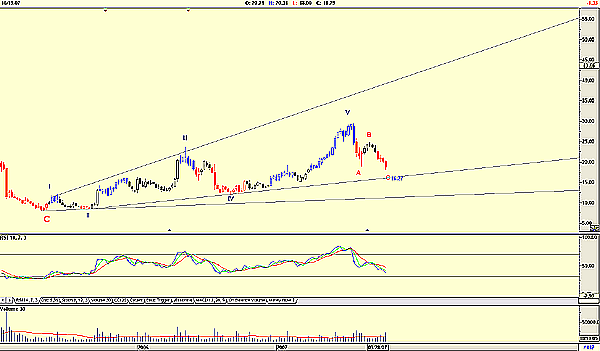
| FIGURE 3: SIERRA WIRELESS, WEEKLY. A second weekly chart of SW can be seen here, with an altered wave count. |
| Graphic provided by: AdvancedGET. |
| |
| Because of this, I had a look at the weekly chart once again (Figure 3) but redid the wave count manually, rather than use the program's built-in wave count. This shows that the C-wave is well and truly in the fourth wave of lesser degree. However, the only objection to the count being complete is the RSI, which is still suggesting weakness to test the support level at 16.27. |
Has been a technical analyst since 1969, and has worked as a futures and options trader with First Financial Futures in Johannesburg, South Africa.
| Address: | 3256 West 24th Ave |
| Vancouver, BC | |
| Phone # for sales: | 6042634214 |
| E-mail address: | petroosp@gmail.com |
Click here for more information about our publications!
Comments
Date: 10/30/07Rank: 4Comment:
Date: 10/30/07Rank: 5Comment:

Request Information From Our Sponsors
- StockCharts.com, Inc.
- Candle Patterns
- Candlestick Charting Explained
- Intermarket Technical Analysis
- John Murphy on Chart Analysis
- John Murphy's Chart Pattern Recognition
- John Murphy's Market Message
- MurphyExplainsMarketAnalysis-Intermarket Analysis
- MurphyExplainsMarketAnalysis-Visual Analysis
- StockCharts.com
- Technical Analysis of the Financial Markets
- The Visual Investor
- VectorVest, Inc.
- Executive Premier Workshop
- One-Day Options Course
- OptionsPro
- Retirement Income Workshop
- Sure-Fire Trading Systems (VectorVest, Inc.)
- Trading as a Business Workshop
- VectorVest 7 EOD
- VectorVest 7 RealTime/IntraDay
- VectorVest AutoTester
- VectorVest Educational Services
- VectorVest OnLine
- VectorVest Options Analyzer
- VectorVest ProGraphics v6.0
- VectorVest ProTrader 7
- VectorVest RealTime Derby Tool
- VectorVest Simulator
- VectorVest Variator
- VectorVest Watchdog
