HOT TOPICS LIST
- MACD
- Fibonacci
- RSI
- Gann
- ADXR
- Stochastics
- Volume
- Triangles
- Futures
- Cycles
- Volatility
- ZIGZAG
- MESA
- Retracement
- Aroon
INDICATORS LIST
LIST OF TOPICS
PRINT THIS ARTICLE
by David Penn
Another day, another look at a setup gone awry.
Position: N/A
David Penn
Technical Writer for Technical Analysis of STOCKS & COMMODITIES magazine, Working-Money.com, and Traders.com Advantage.
PRINT THIS ARTICLE
TECHNICAL ANALYSIS
Rate Breakdown: 10-Year Yields Get Whacked
10/25/07 08:50:38 AMby David Penn
Another day, another look at a setup gone awry.
Position: N/A
| About a week ago I looked at the bullish prospects for 10-year Treasury yields ("10-Year Treasury Yields: Up, Up, And Away?" Traders.com Advantage; October 16, 2007). At the time, the $TNX looked like it was very well set up to move higher: there was a solid positive divergence in the moving average convergence/divergence (MACD) histogram, a spike higher in the histogram immediately following the divergence, and a confirmed BOSO breakout as the stochastic moved into overbought territory. But a funny thing happened on the way to higher 10-year yields: panic. |
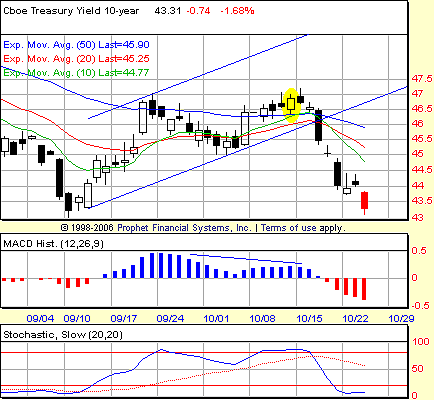
| Nervous investors began swapping bonds for stocks on October 17, and within days, both the stock market and the yields on the 10-year Treasury note were in sudden sharp decline. While the $TNX has not set a new low as of this writing, the force with which the market turned around to the downside in mid-October likely caught more than a few speculators on the wrong side of things. See Figure 1. |

|
| FIGURE 1: 10-YEAR TREASURY NOTE YIELD INDEX, DAILY. Negative divergences in both the MACD histogram and stochastic developed just after a confirmed long signal in the stochastic (BOSO breakout). Those negative divergences were confirmed one session before the 10-year T-note yield index plunged below the 50-day exponential moving average en route to lower levels. |
| Graphic provided by: Prophet Financial, Inc. |
| |
| As I did with another market analysis that turned out differently than anticipated (see my Traders.com Advantage piece, "Dollar Down Against The Yen: Revisiting The Ascending Triangle In USD/JPY," from October 23, 2007), let's take a look at this reversal session by session to see what clues might have been available to warn traders when the "can't-lose" long turned into — at least — a short-term opportunity for the bears. |
| It was not a big surprise that the breakdown in the $TNX was so sharp. The technical picture was quite promising coming out of the first half of October: trend channel and moving average support, a sizable positive divergence in the MACD histogram, and the confirmed BOSO long signal in the stochastic. However, when the $TNX formed negative divergences in both the MACD histogram and stochastic the day after the stochastic buy signal was confirmed — and when those negative divergences were confirmed by a lower, follow-through close on the day after that — the potential for the long trade needed to be reevaluated in light of the reality of indicators gone if not wild then certainly not bullish, either. |
| The day after the bearish signals were confirmed, the $TNX crashed, falling from roughly 4.64 to 4.54. Over the next five days, the $TNX only moved lower until it was testing those very same early September lows whence the rally had come. It goes without saying that, given the previous positive divergences, it will be very much worth watching to see whether those early September lows hold. |
Technical Writer for Technical Analysis of STOCKS & COMMODITIES magazine, Working-Money.com, and Traders.com Advantage.
| Title: | Technical Writer |
| Company: | Technical Analysis, Inc. |
| Address: | 4757 California Avenue SW |
| Seattle, WA 98116 | |
| Phone # for sales: | 206 938 0570 |
| Fax: | 206 938 1307 |
| Website: | www.Traders.com |
| E-mail address: | DPenn@traders.com |
Traders' Resource Links | |
| Charting the Stock Market: The Wyckoff Method -- Books | |
| Working-Money.com -- Online Trading Services | |
| Traders.com Advantage -- Online Trading Services | |
| Technical Analysis of Stocks & Commodities -- Publications and Newsletters | |
| Working Money, at Working-Money.com -- Publications and Newsletters | |
| Traders.com Advantage -- Publications and Newsletters | |
| Professional Traders Starter Kit -- Software | |
Click here for more information about our publications!
PRINT THIS ARTICLE

|

Request Information From Our Sponsors
- StockCharts.com, Inc.
- Candle Patterns
- Candlestick Charting Explained
- Intermarket Technical Analysis
- John Murphy on Chart Analysis
- John Murphy's Chart Pattern Recognition
- John Murphy's Market Message
- MurphyExplainsMarketAnalysis-Intermarket Analysis
- MurphyExplainsMarketAnalysis-Visual Analysis
- StockCharts.com
- Technical Analysis of the Financial Markets
- The Visual Investor
- VectorVest, Inc.
- Executive Premier Workshop
- One-Day Options Course
- OptionsPro
- Retirement Income Workshop
- Sure-Fire Trading Systems (VectorVest, Inc.)
- Trading as a Business Workshop
- VectorVest 7 EOD
- VectorVest 7 RealTime/IntraDay
- VectorVest AutoTester
- VectorVest Educational Services
- VectorVest OnLine
- VectorVest Options Analyzer
- VectorVest ProGraphics v6.0
- VectorVest ProTrader 7
- VectorVest RealTime Derby Tool
- VectorVest Simulator
- VectorVest Variator
- VectorVest Watchdog
